Happy new year!
Leslie Yang
Can't believe it's 2015 already! I've never been big on resolutions but I do have one goal, which is to complete more projects. Here's what inspired me:
Message me if you'd like to review my work. Thanks!
123 Street Avenue, City Town, 99999
(123) 555-6789
You can set your address, phone number, email and site description in the settings tab.
Link to read me page with more information.
Musings on visual and UX design, digital manufacturing, eco fashion, coding, and everything else in between and sideways.
Can't believe it's 2015 already! I've never been big on resolutions but I do have one goal, which is to complete more projects. Here's what inspired me:
Sometimes I get caught up doing the same thing all the time, so I like to tackle a different design problems to keep my perspective fresh. I took on creating an app to match coworkers looking to play ping pong together.
Click on the image below or click here for the full breakdown.
Did a 30 min exercise reimagining Pepsi as the PBR of soda. The moodboard (comprised of images from Flickr and Dribbble):
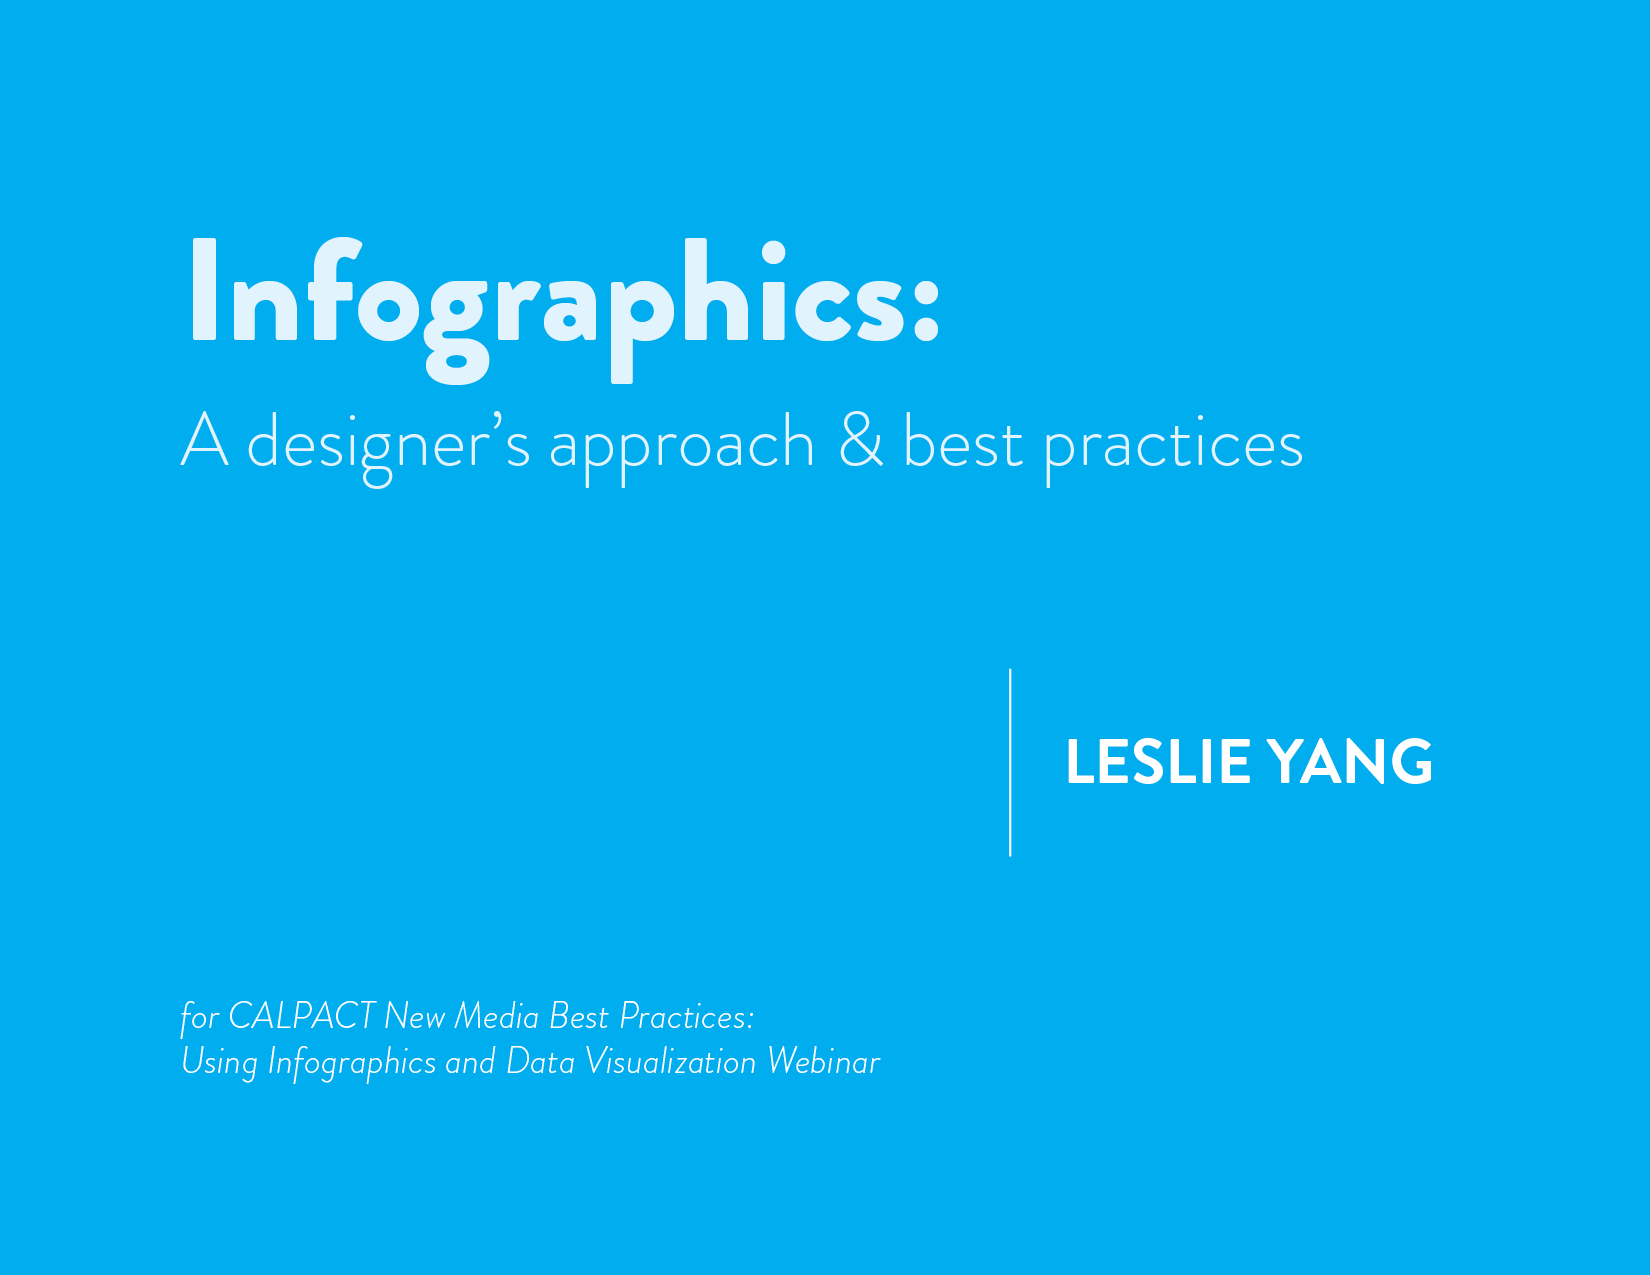
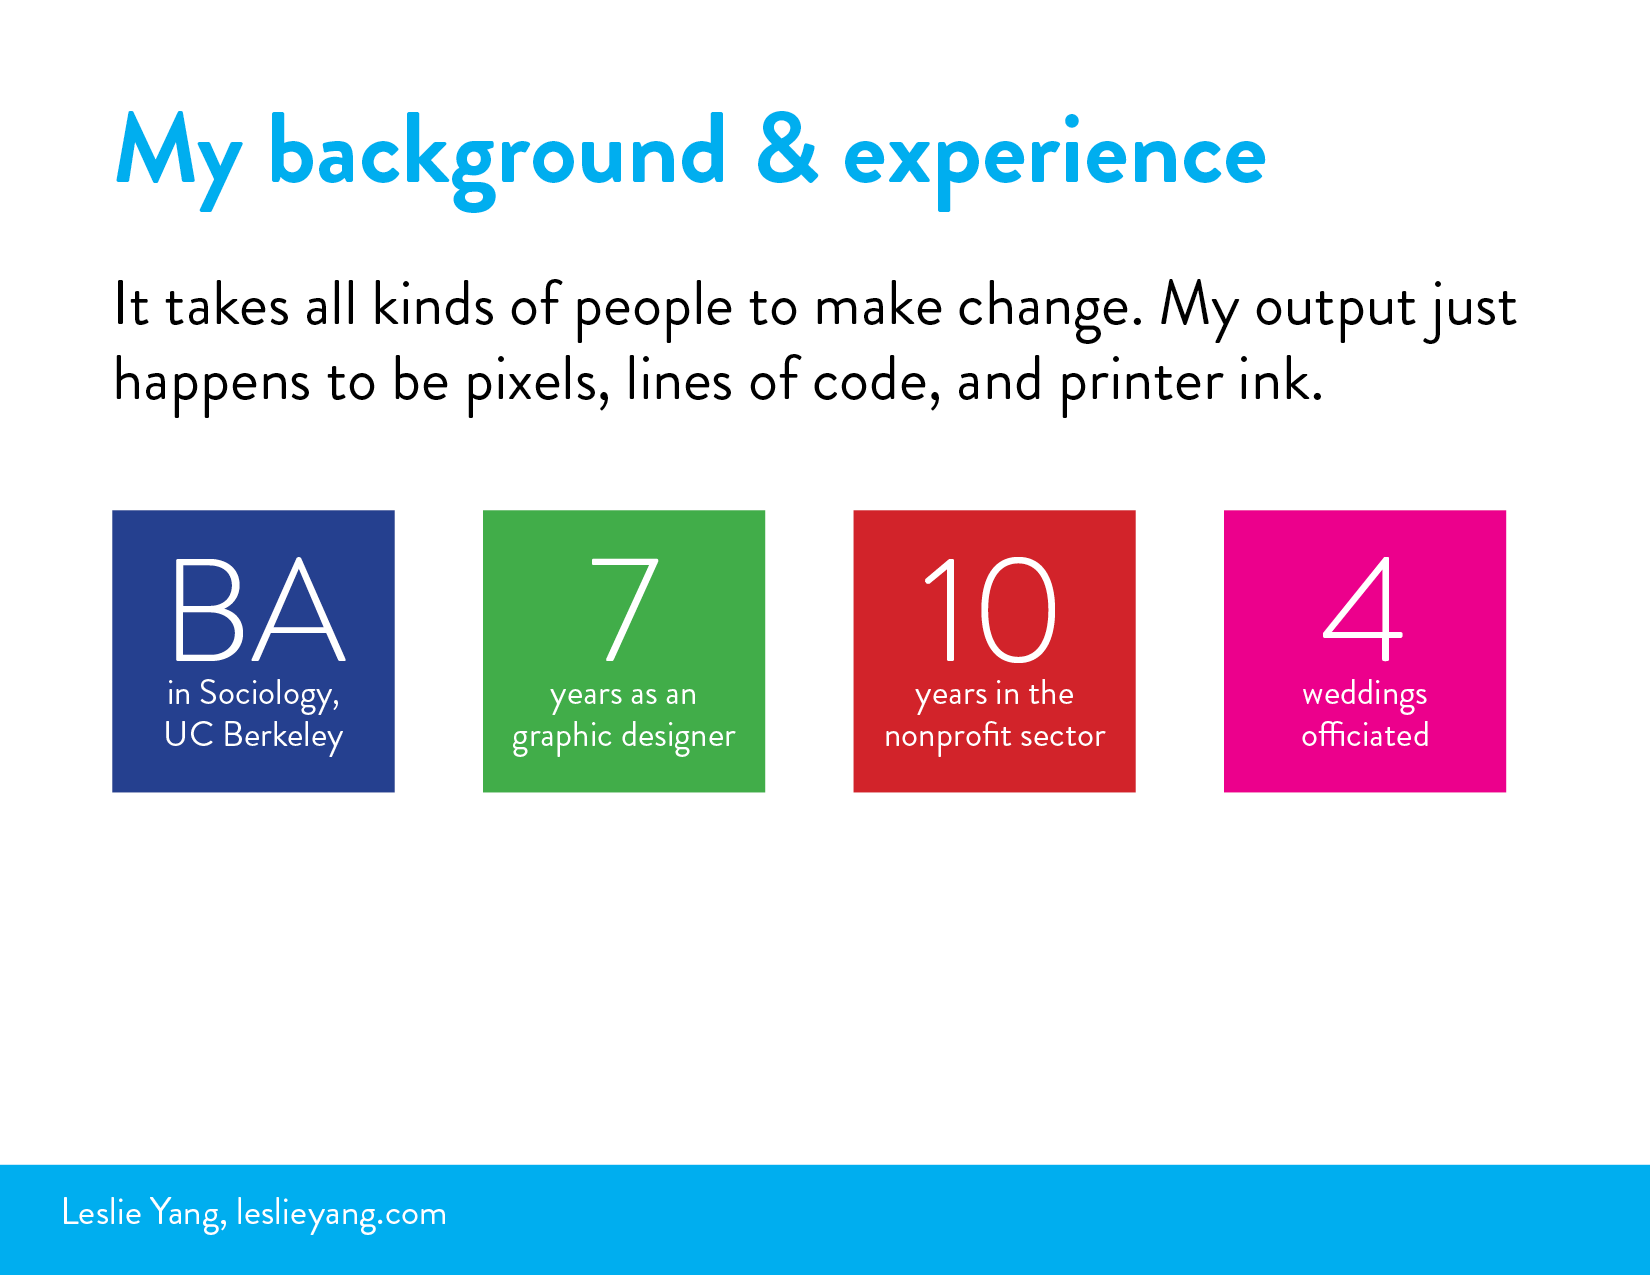
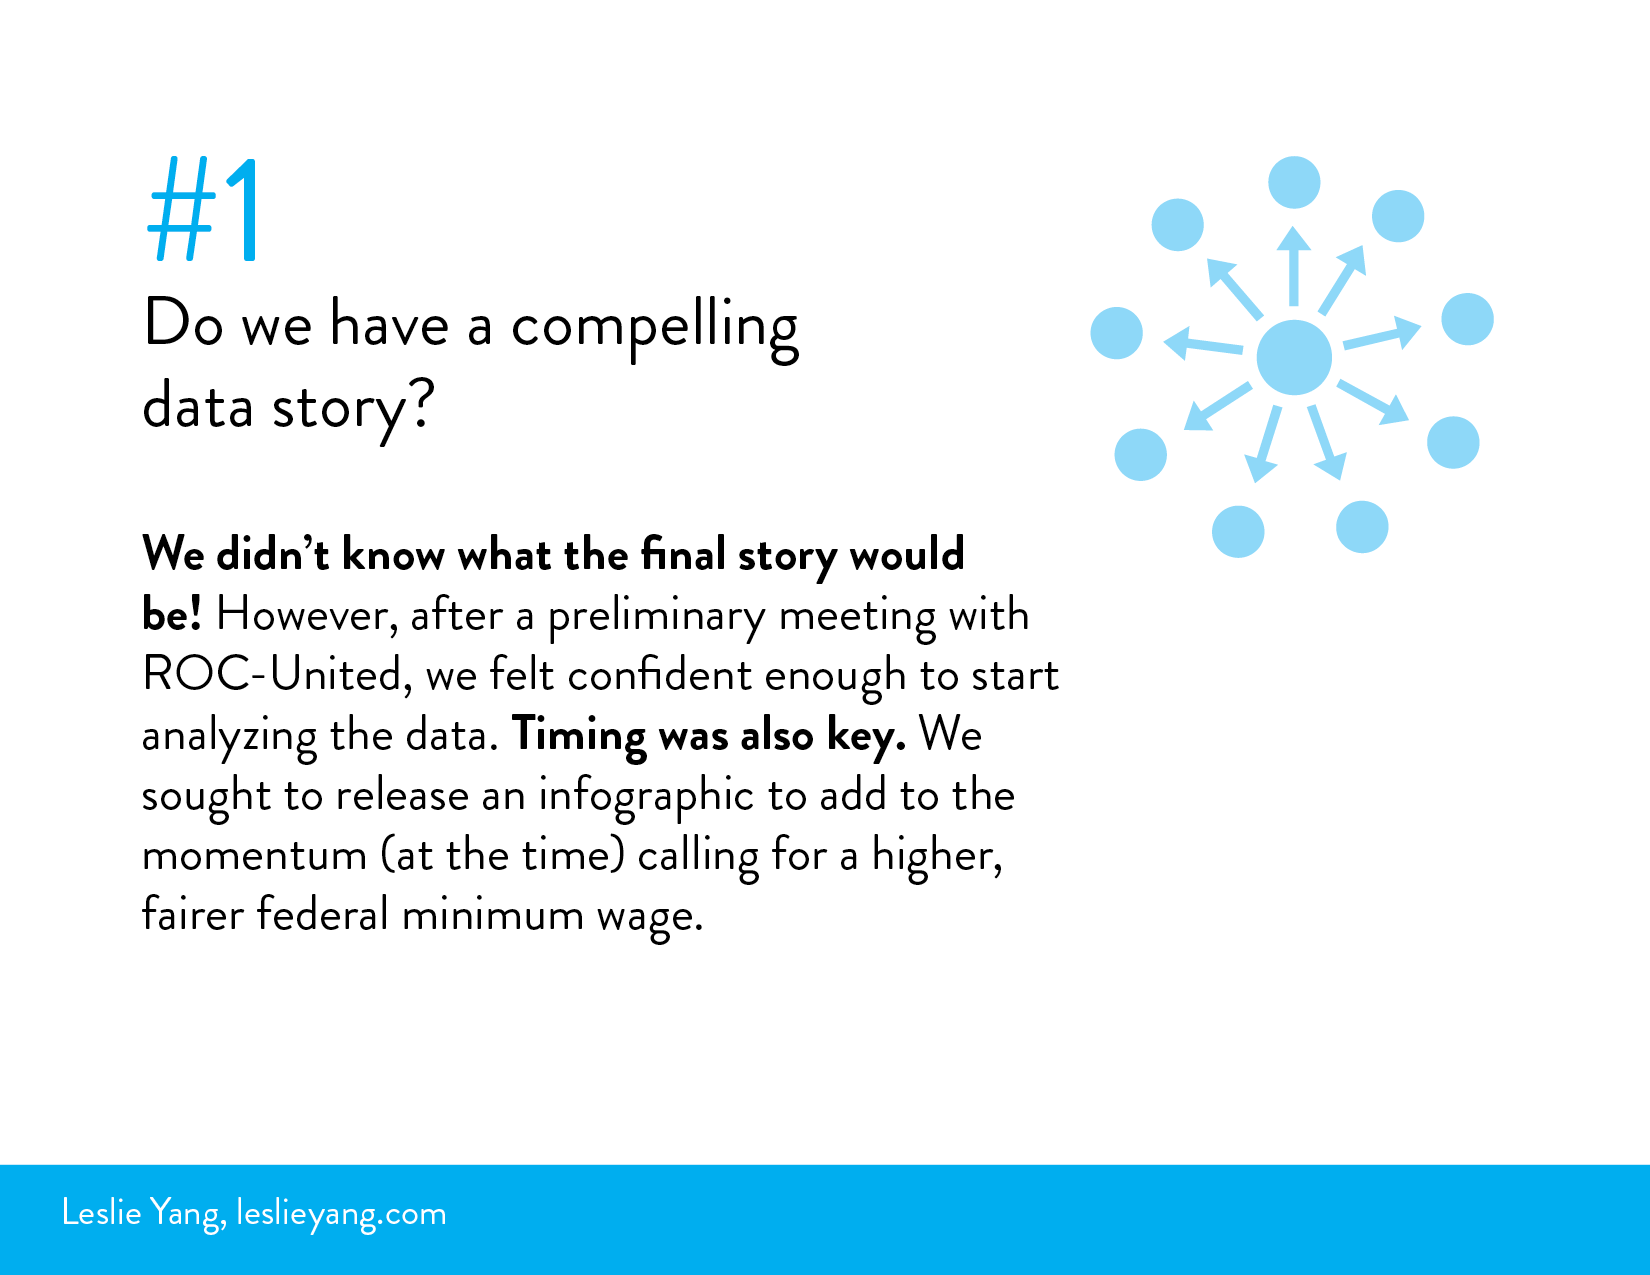
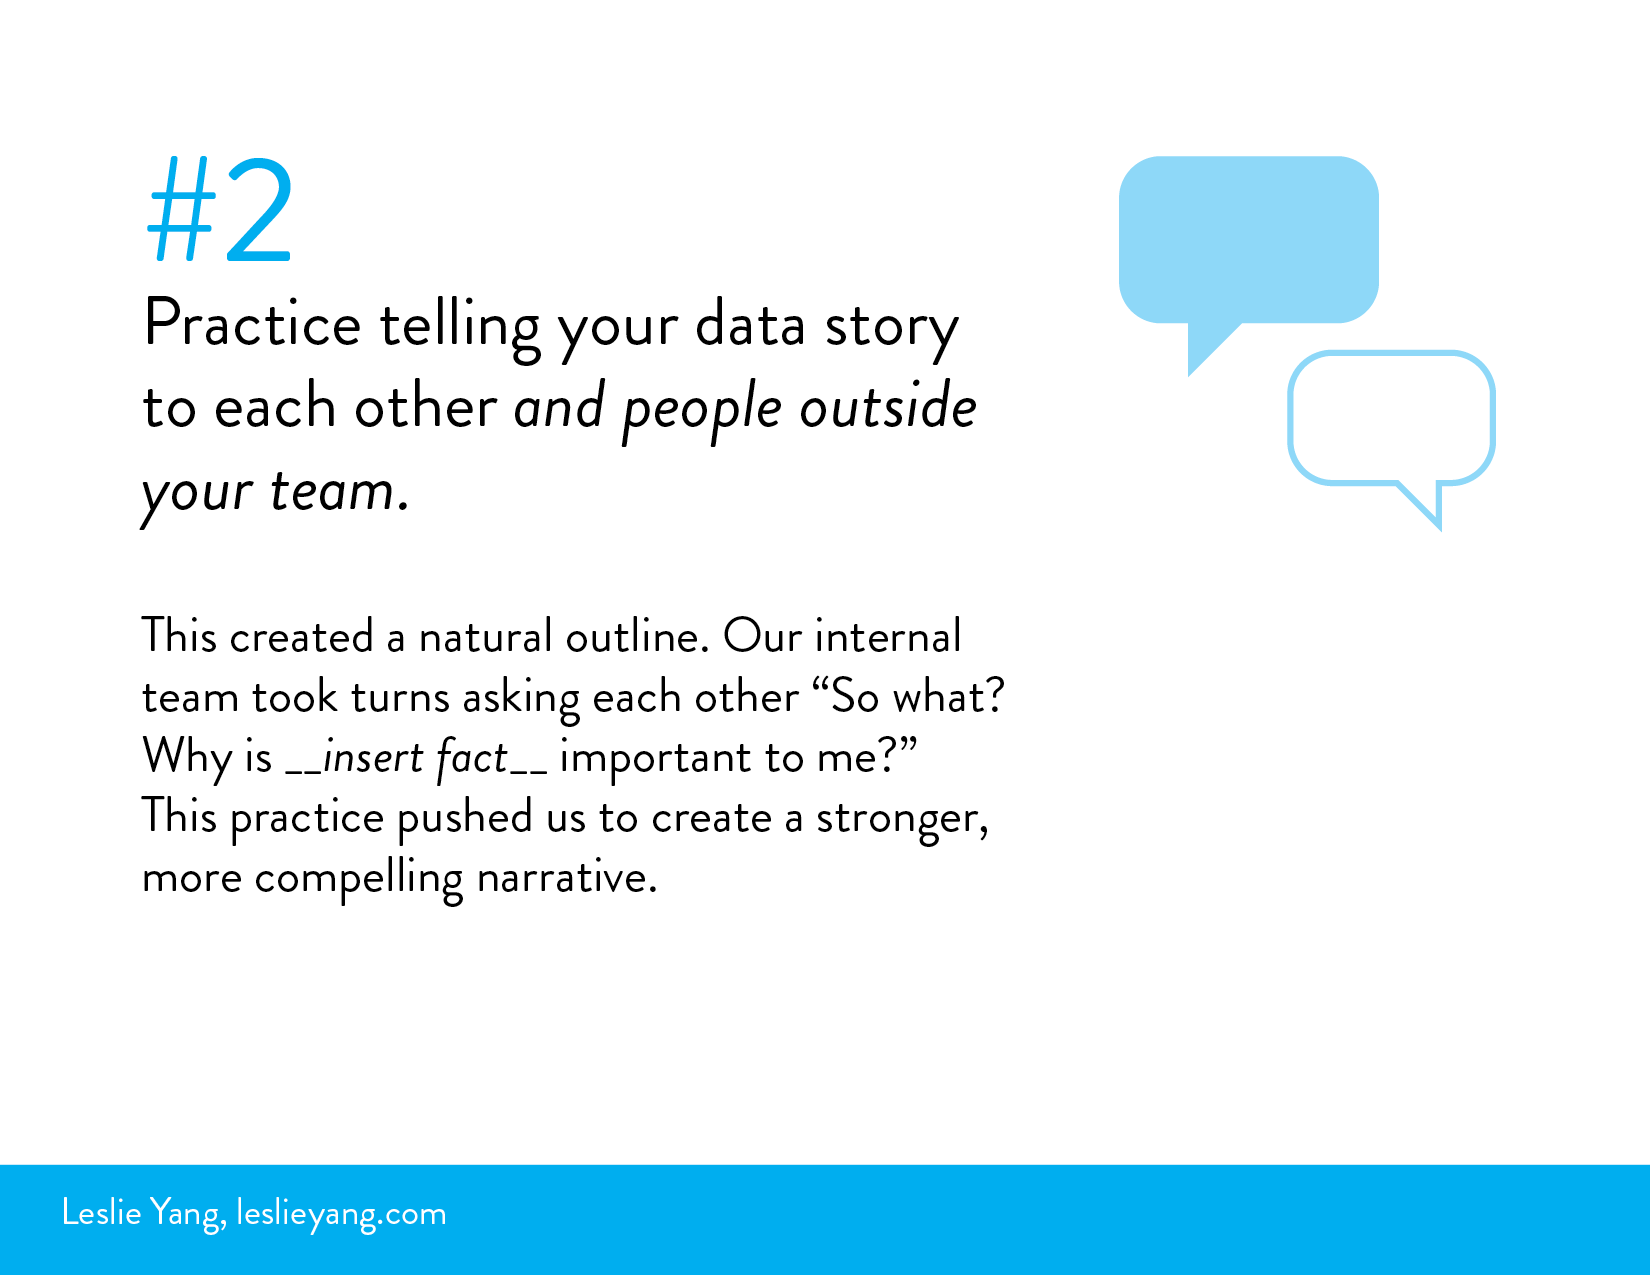
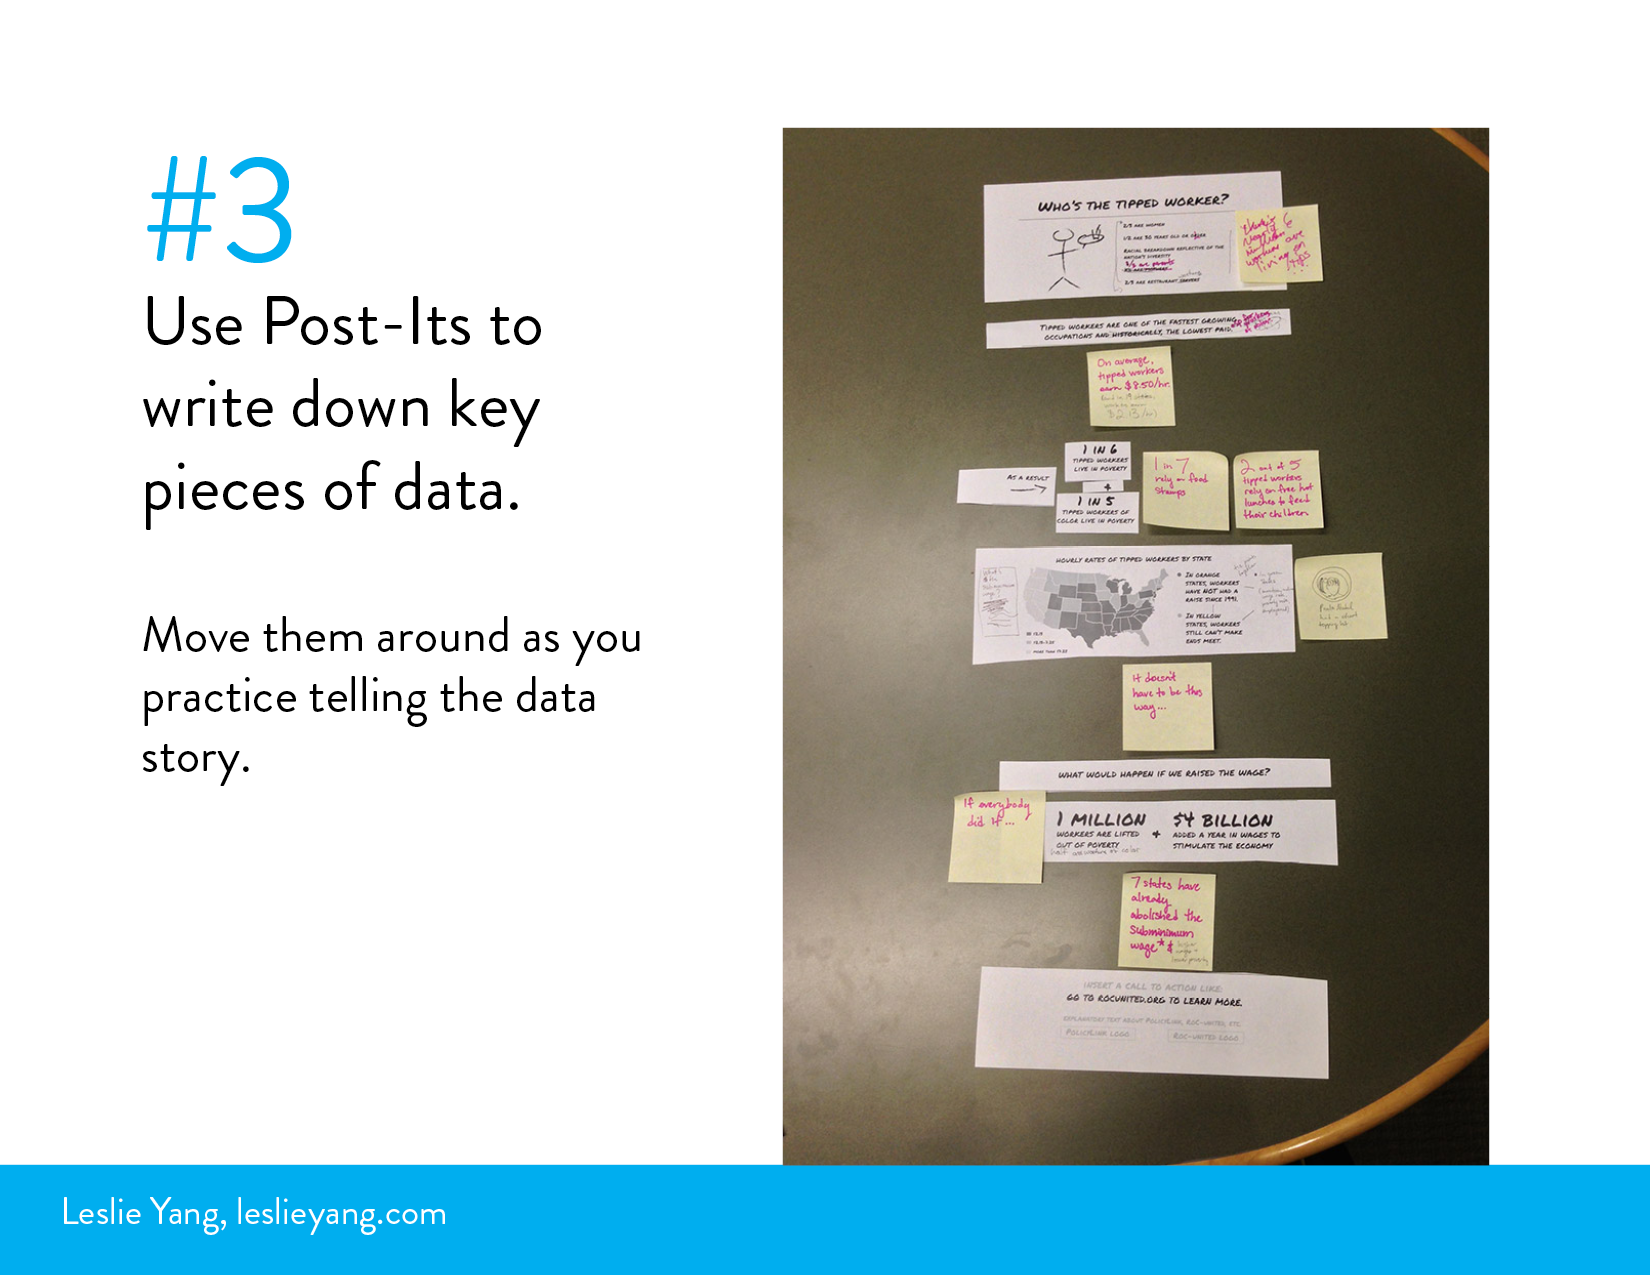
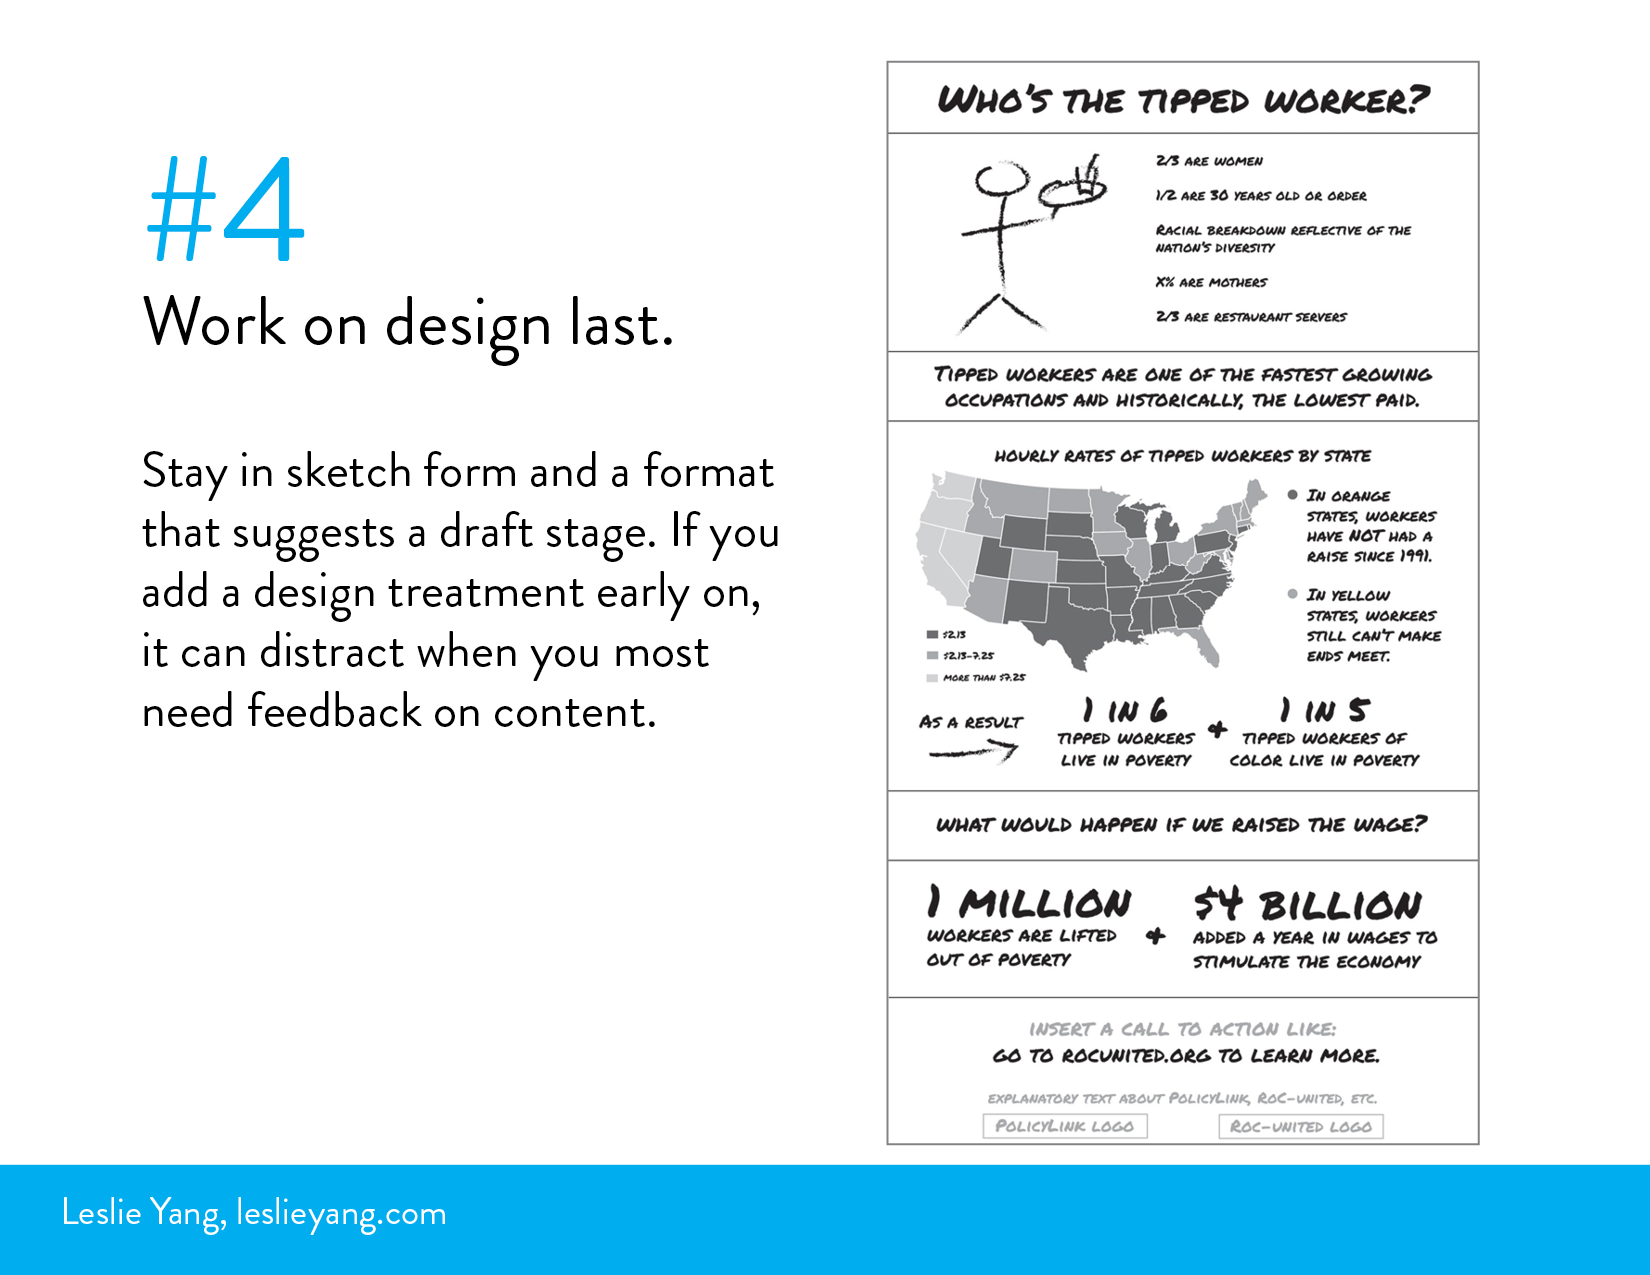
Just wrapped my first webinar on the topic of infographics. After spending years as an in-house designer, it was great to share all the ideas and insight I'd long wanted to offer to clients and non-designers.
The presentation was for the California Pacific Public Health Training Center (CALPACT), Center for Health Leadership (CHL), UC Berkeley School of Public Health.
Slides below. Here's the PDF.
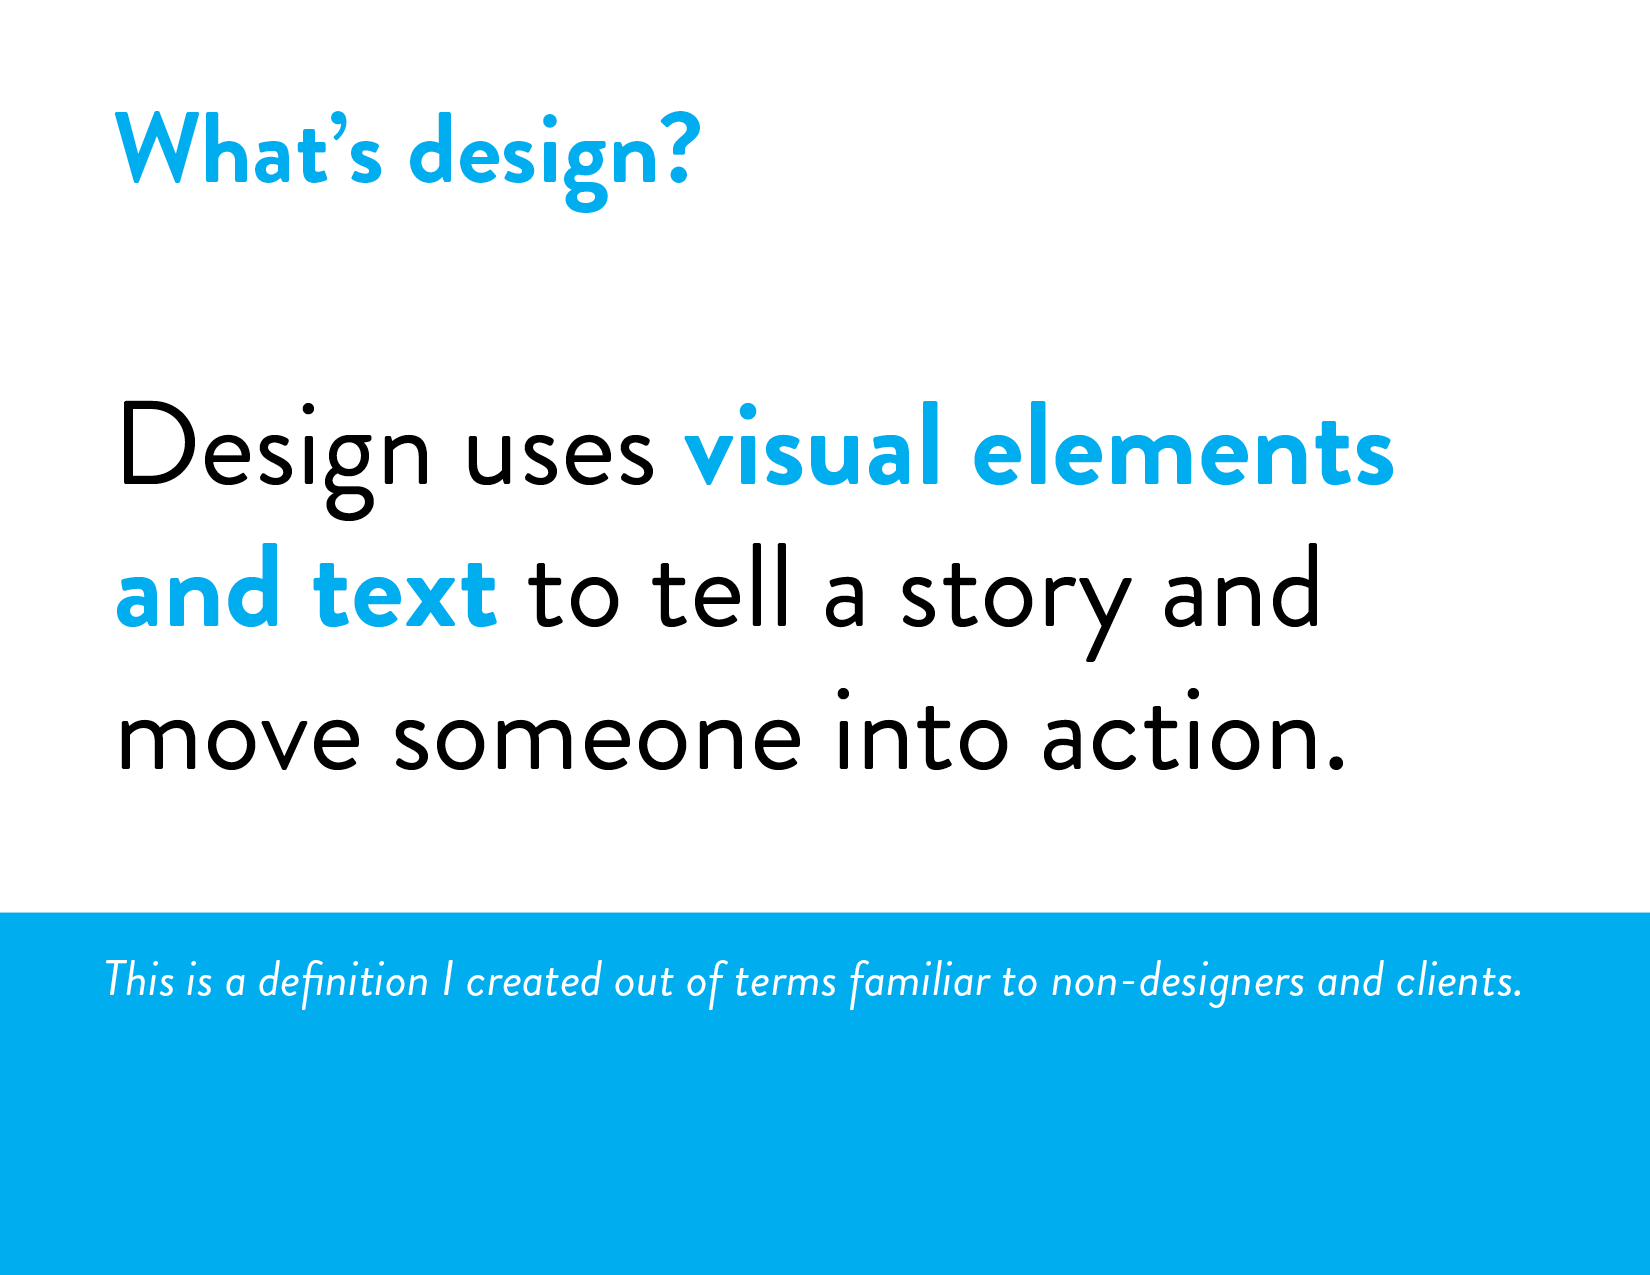
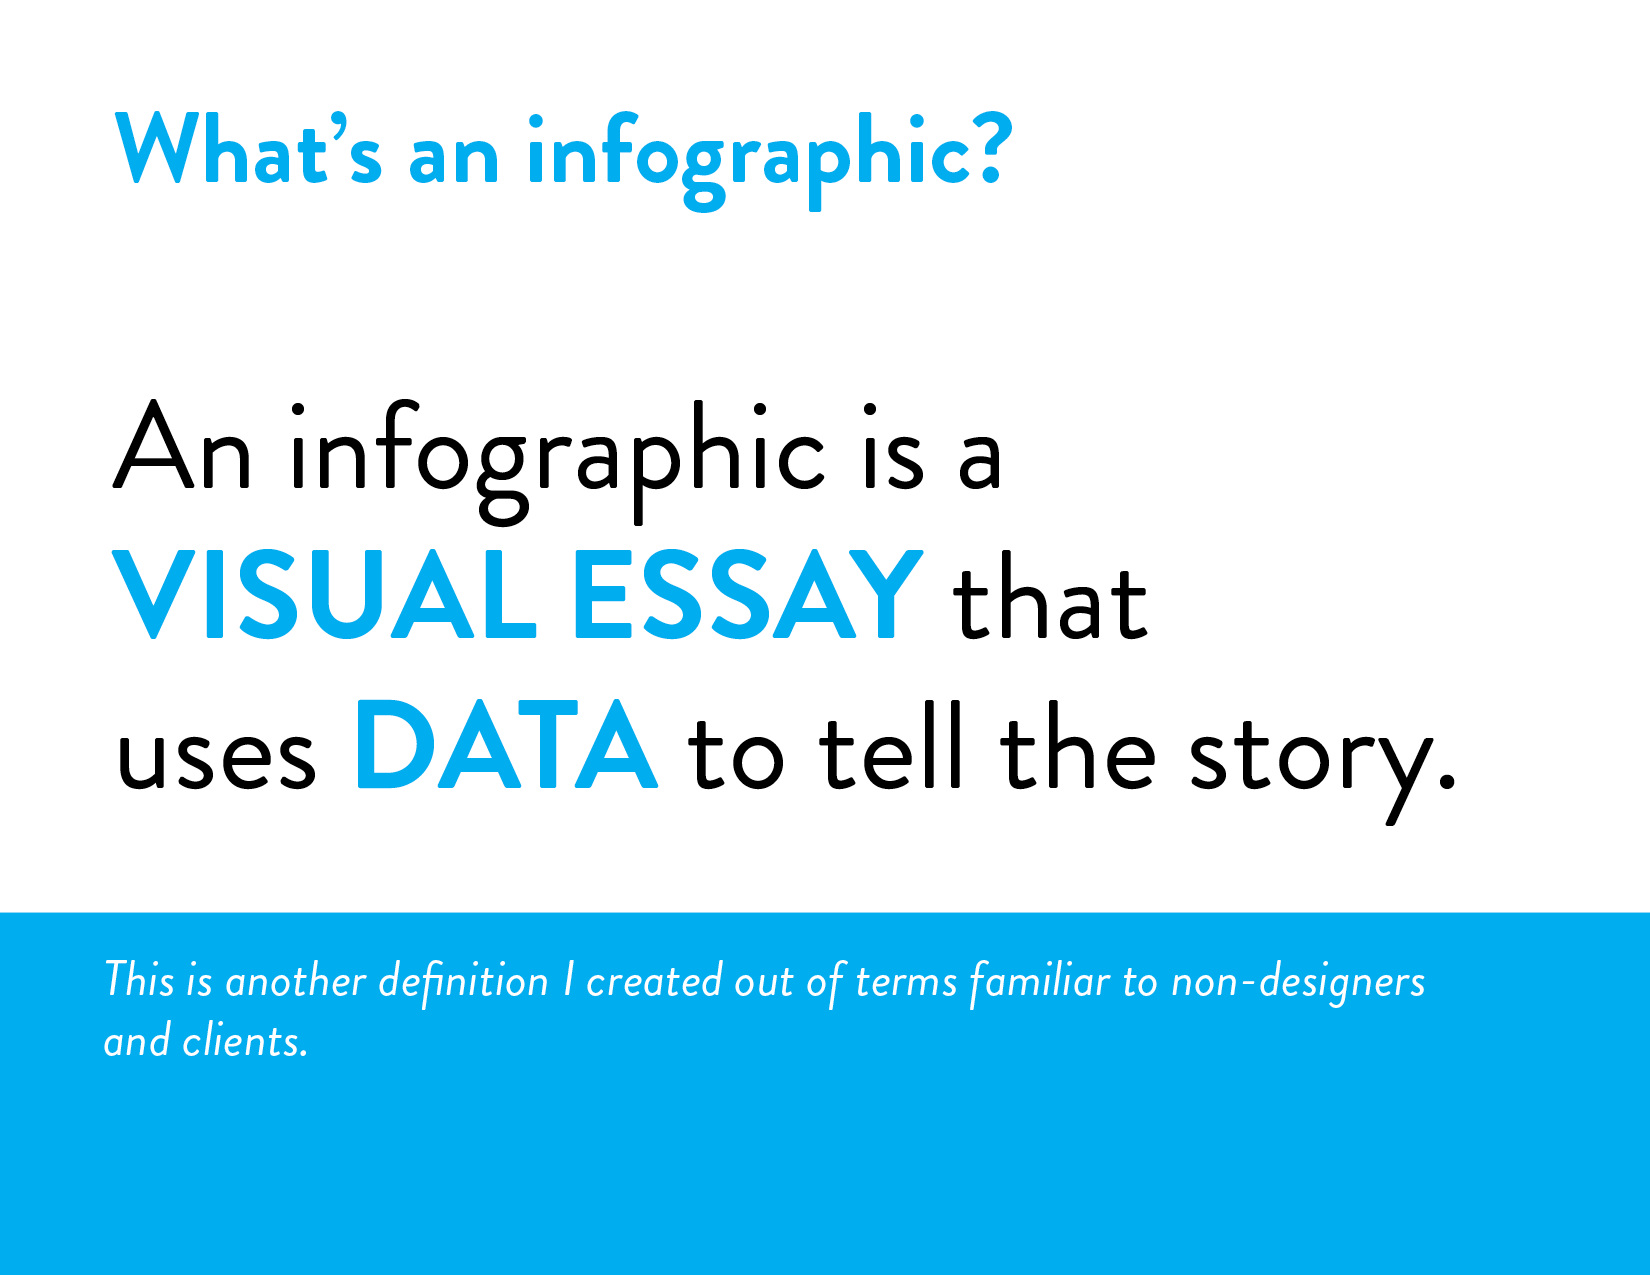

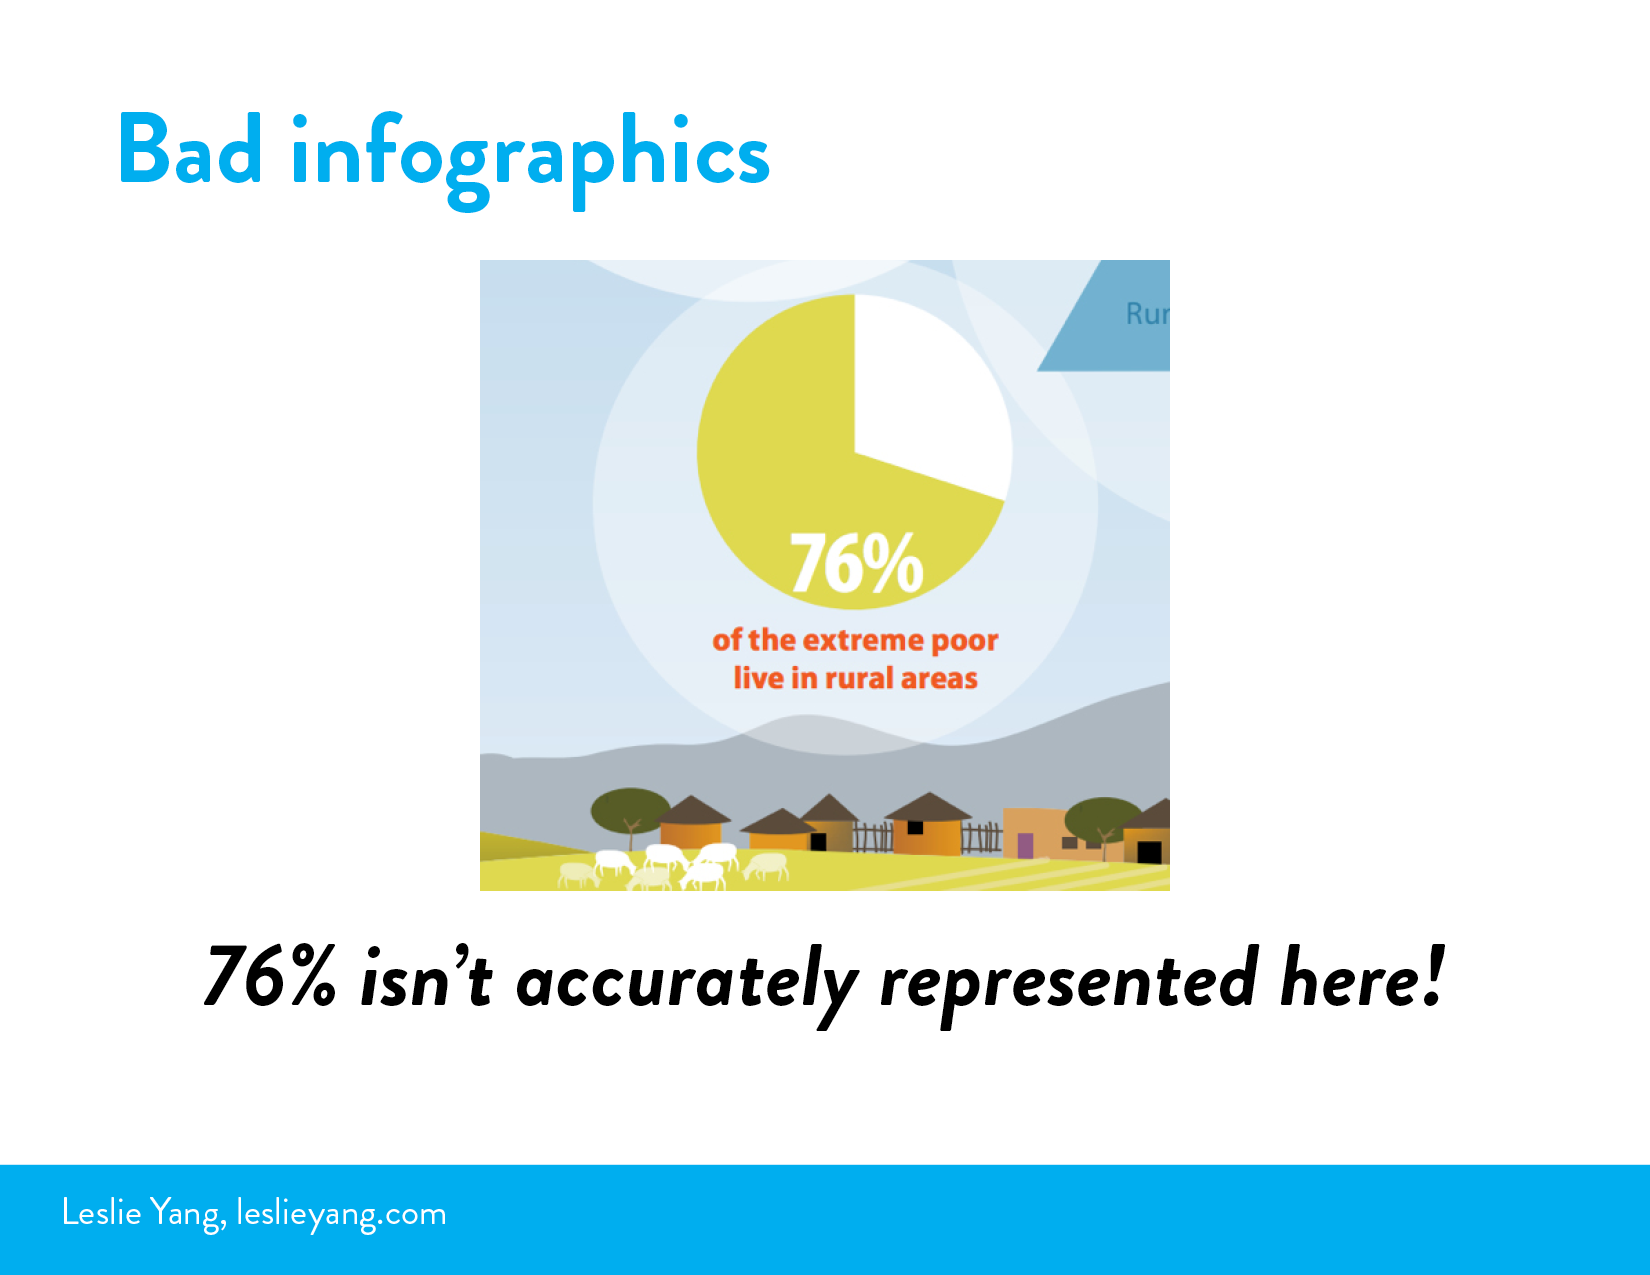
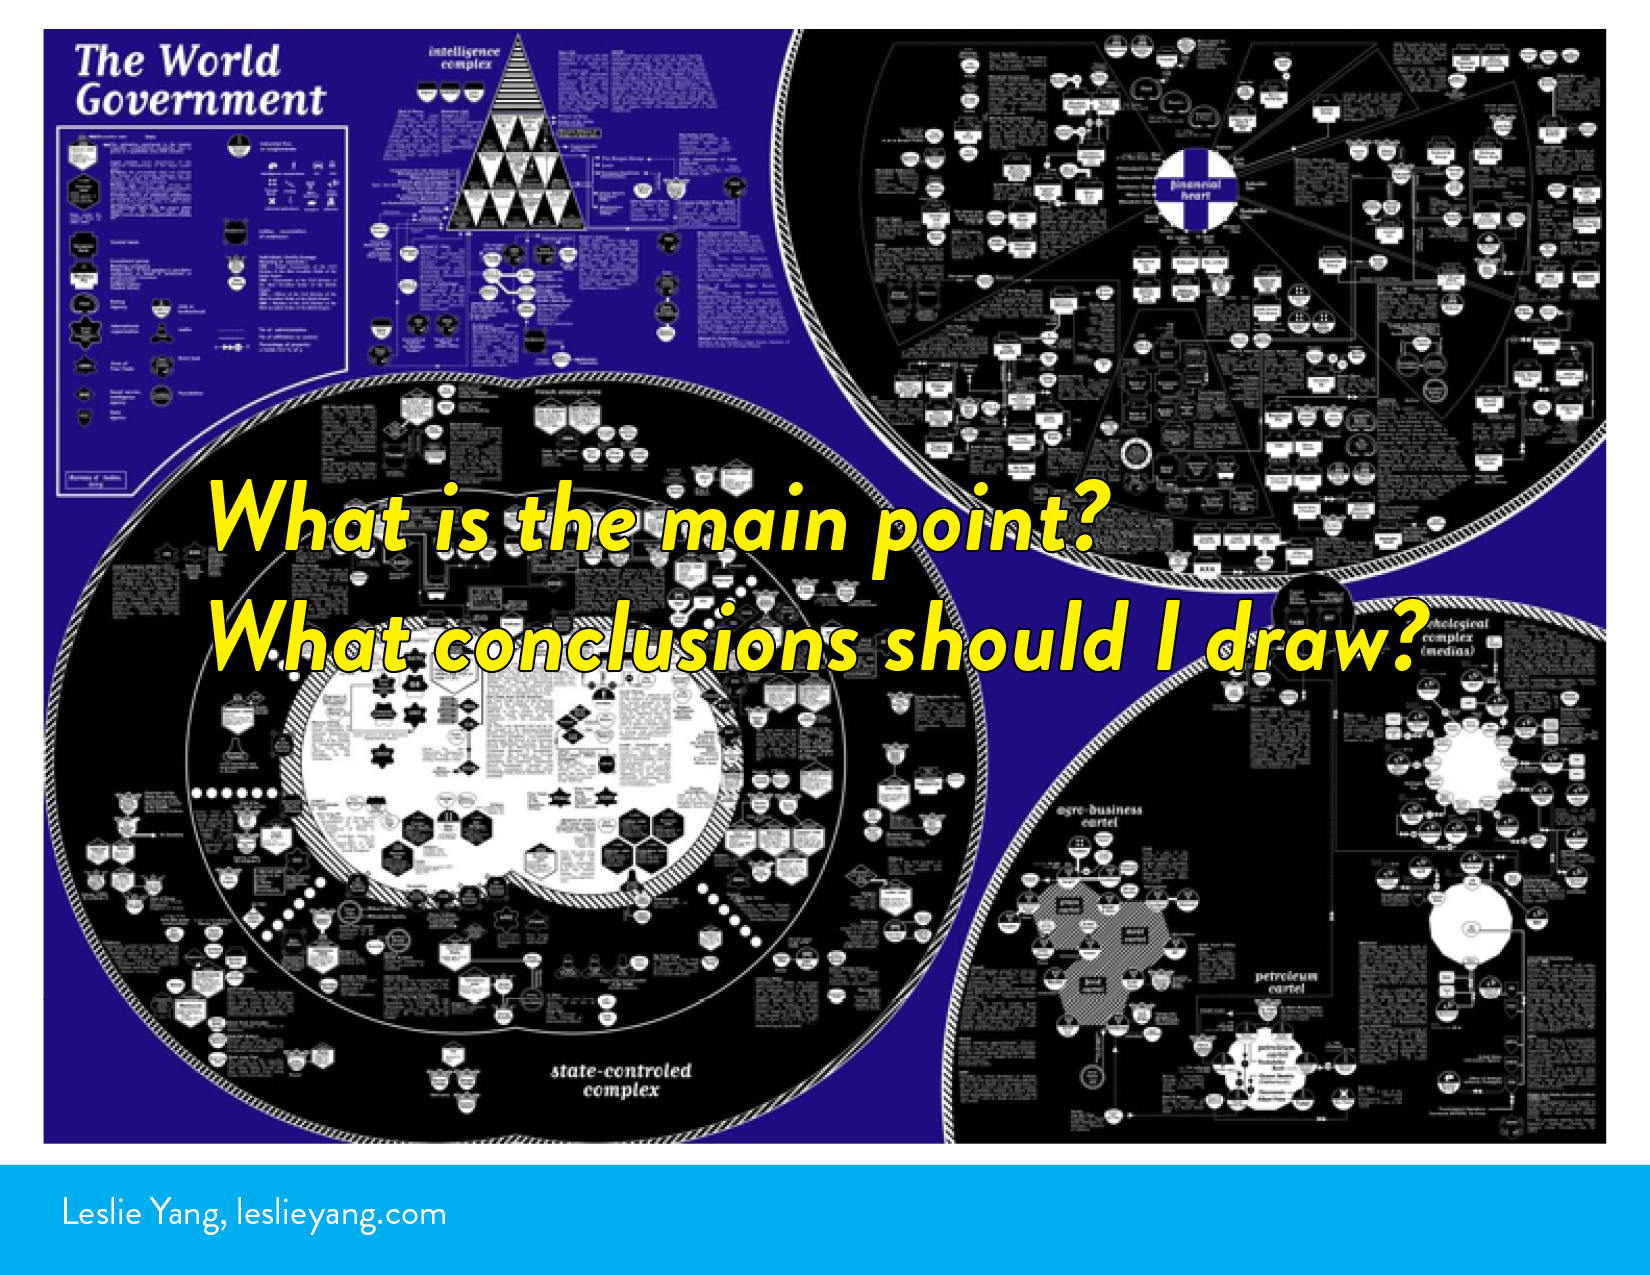
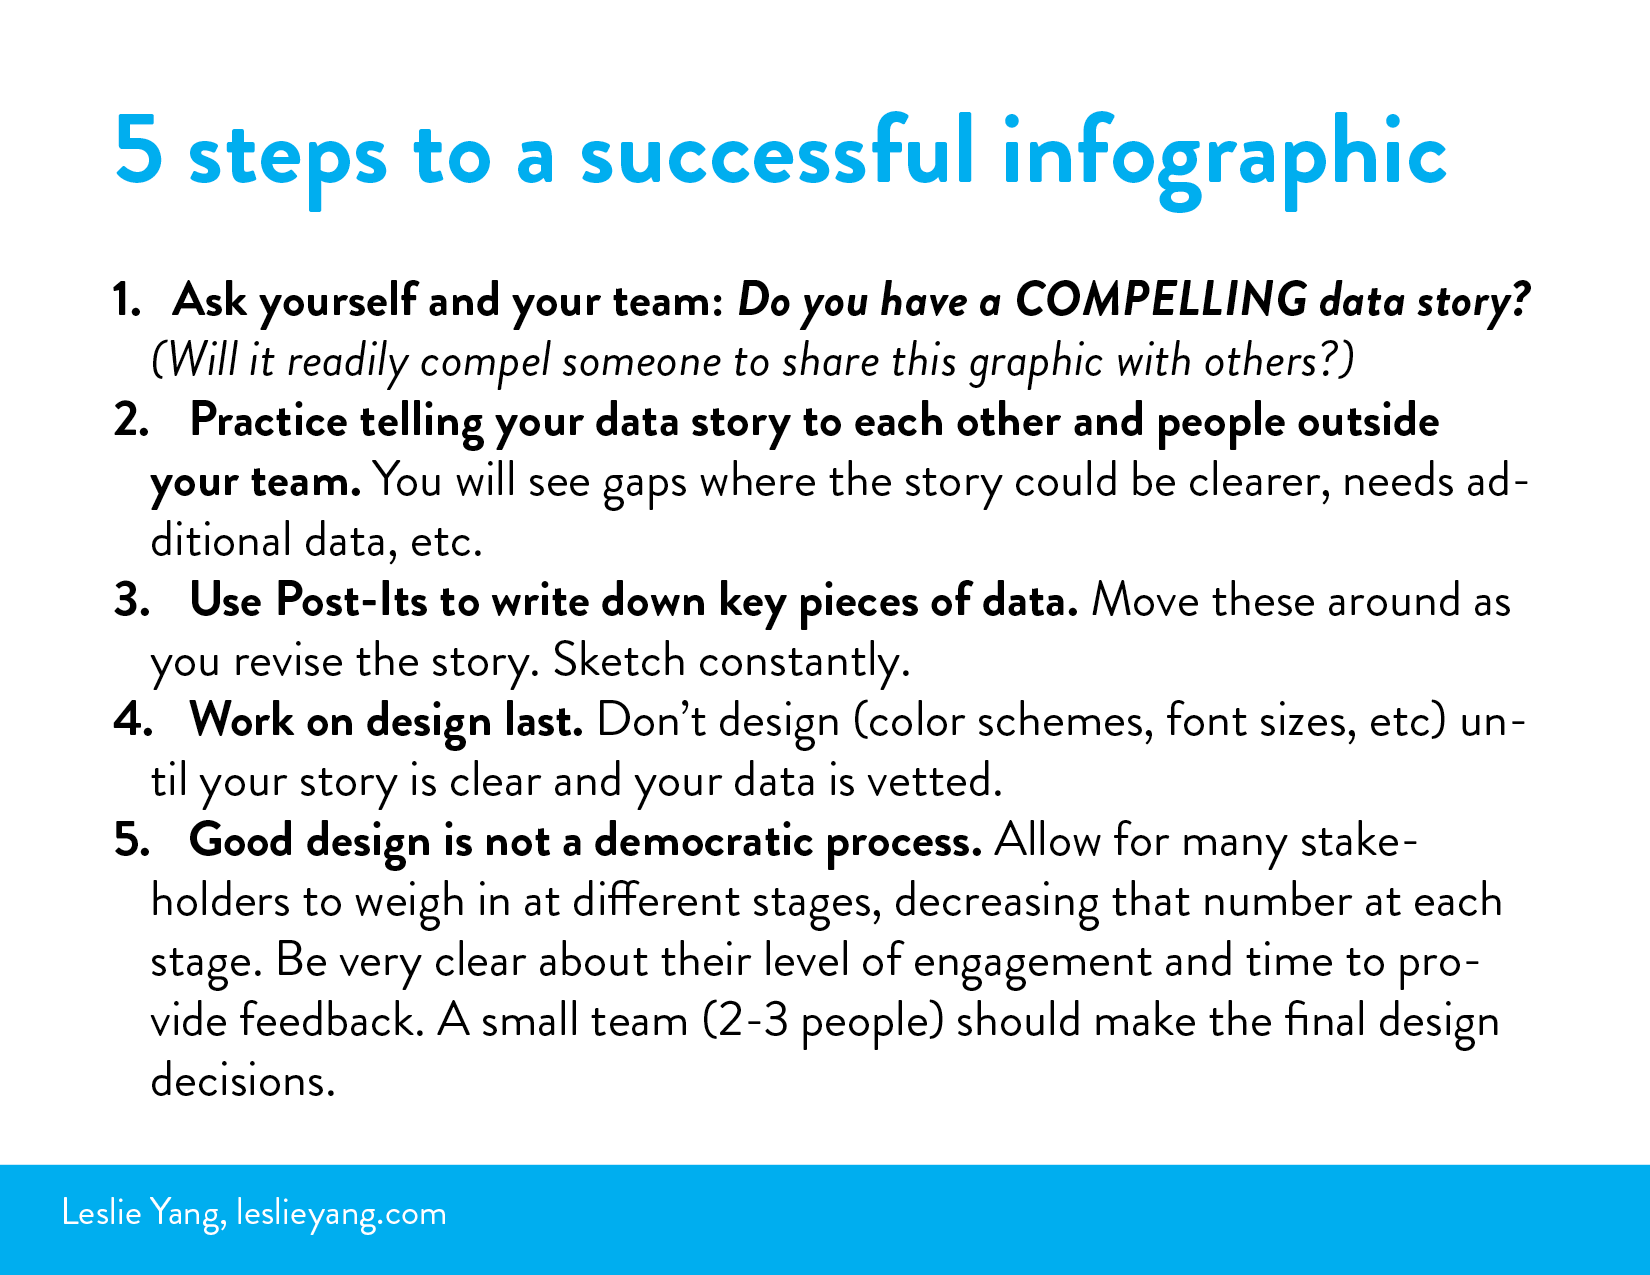
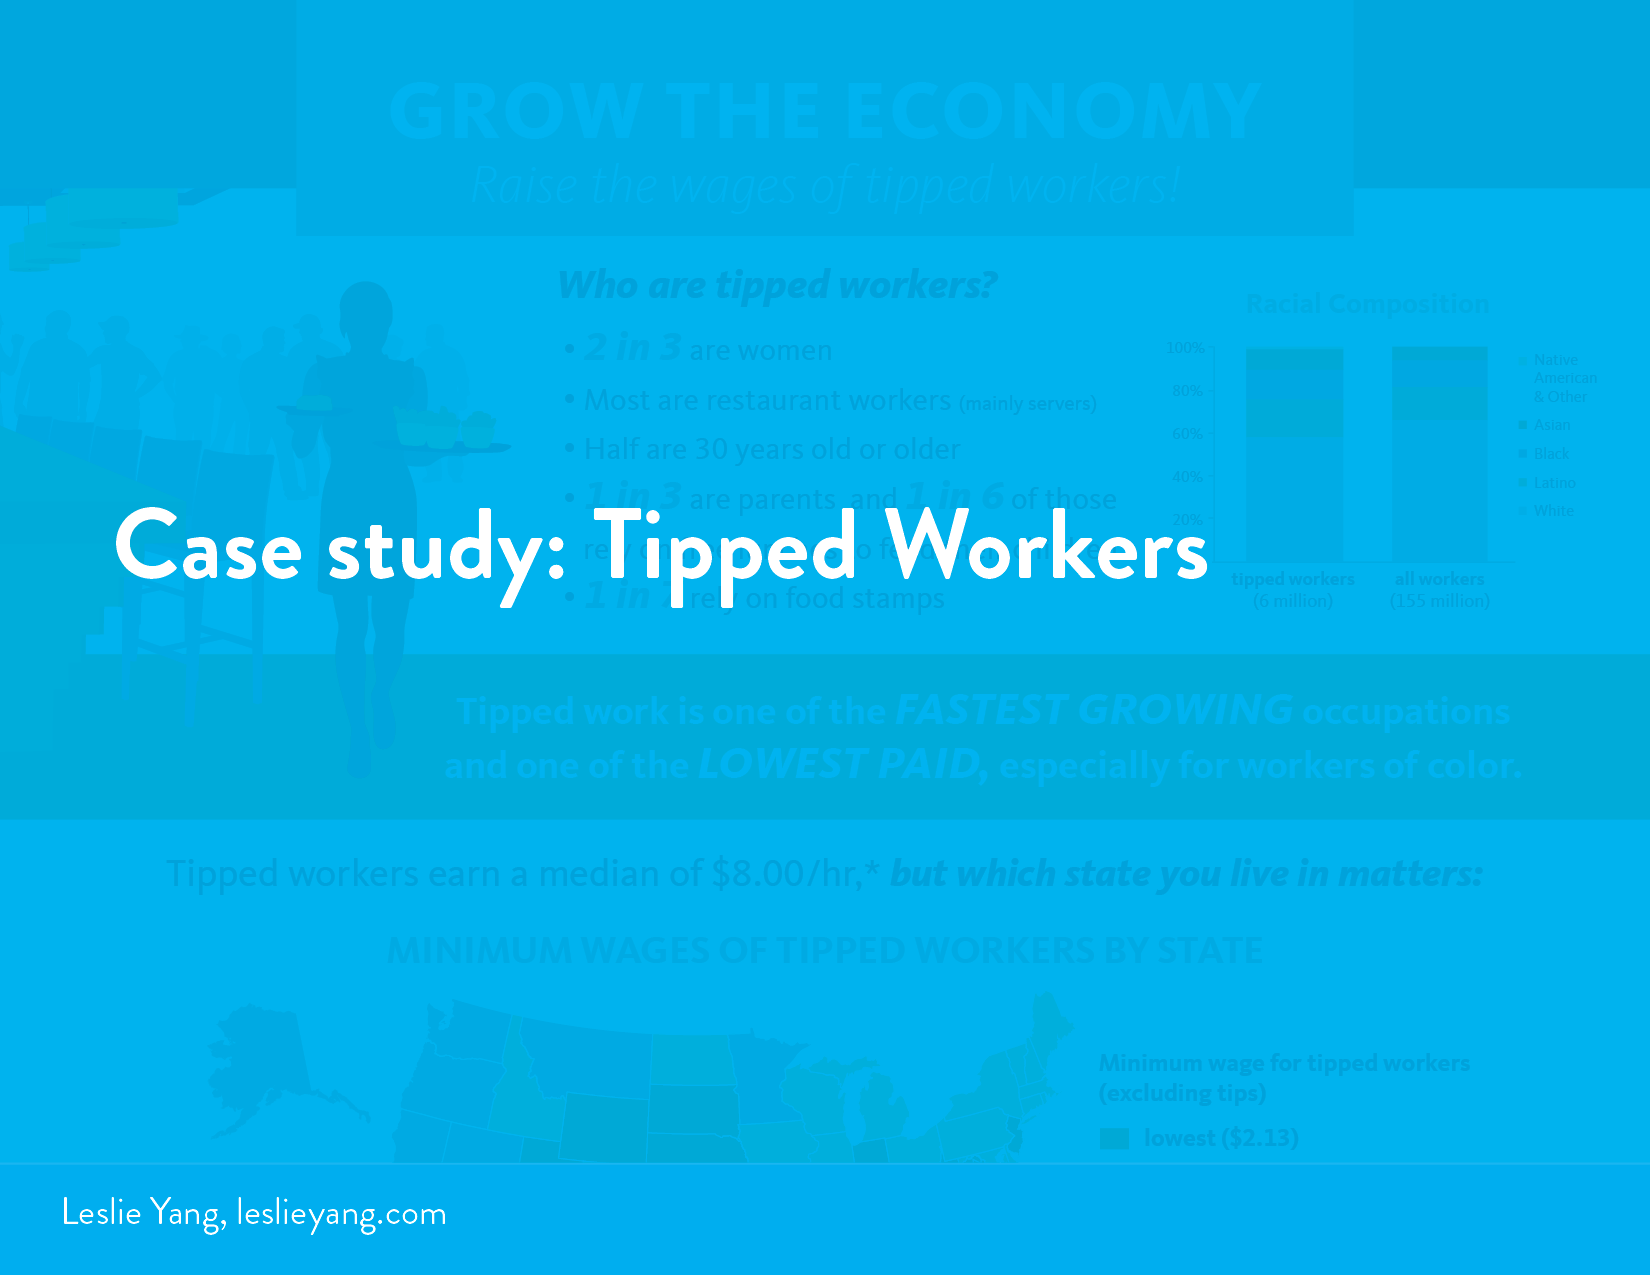
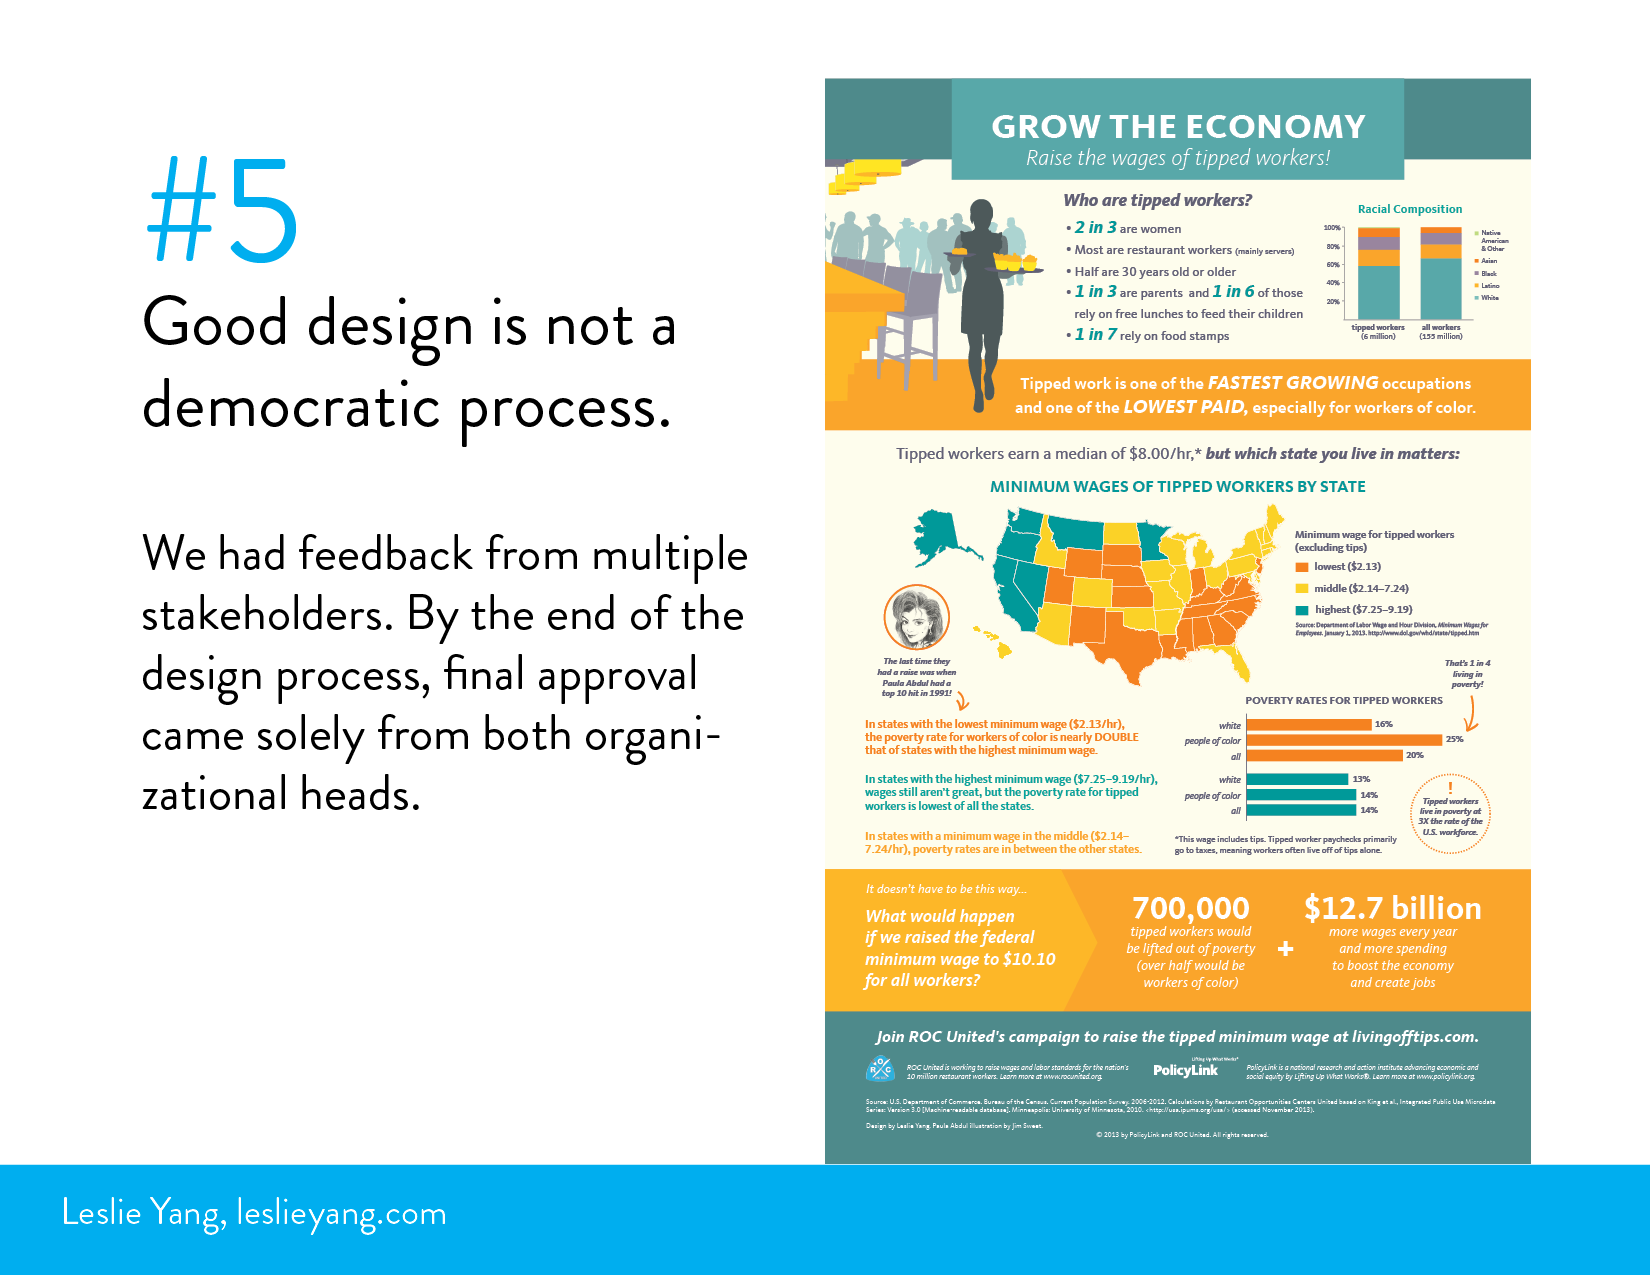
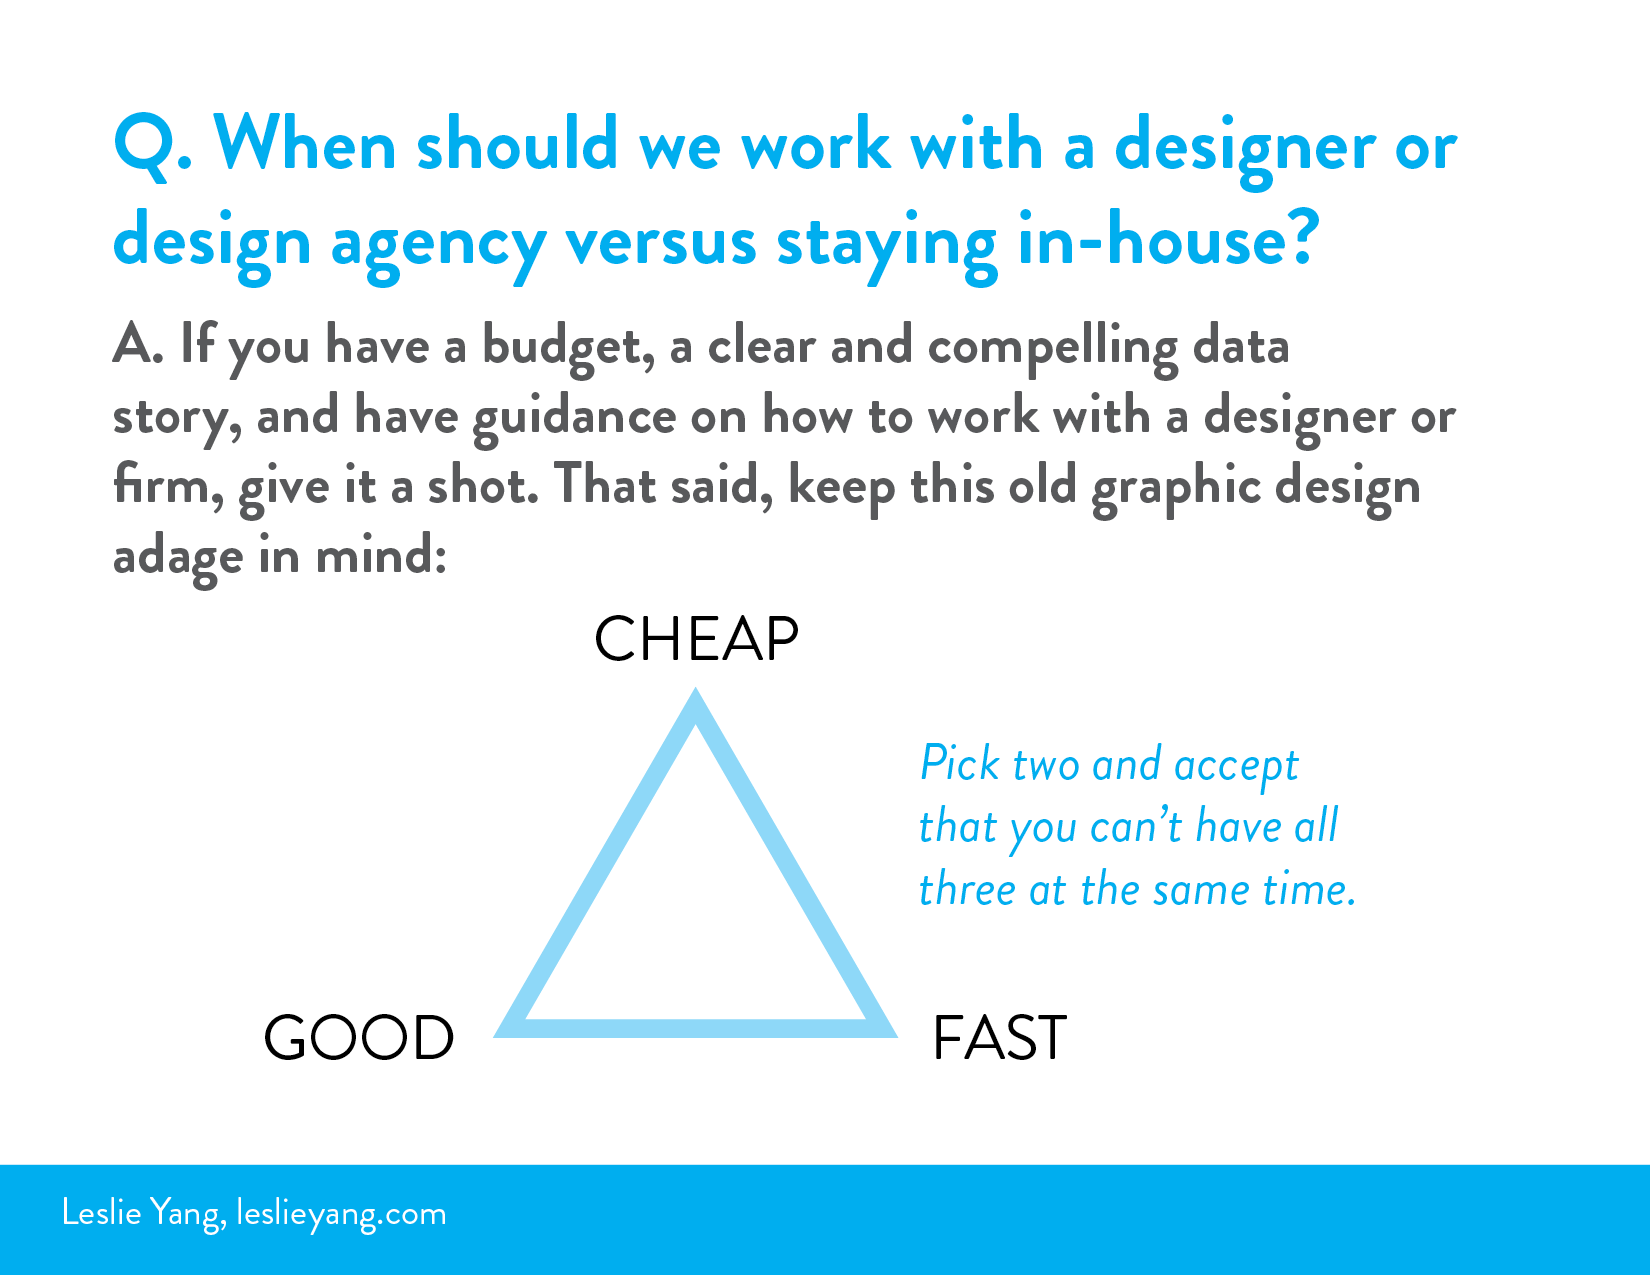
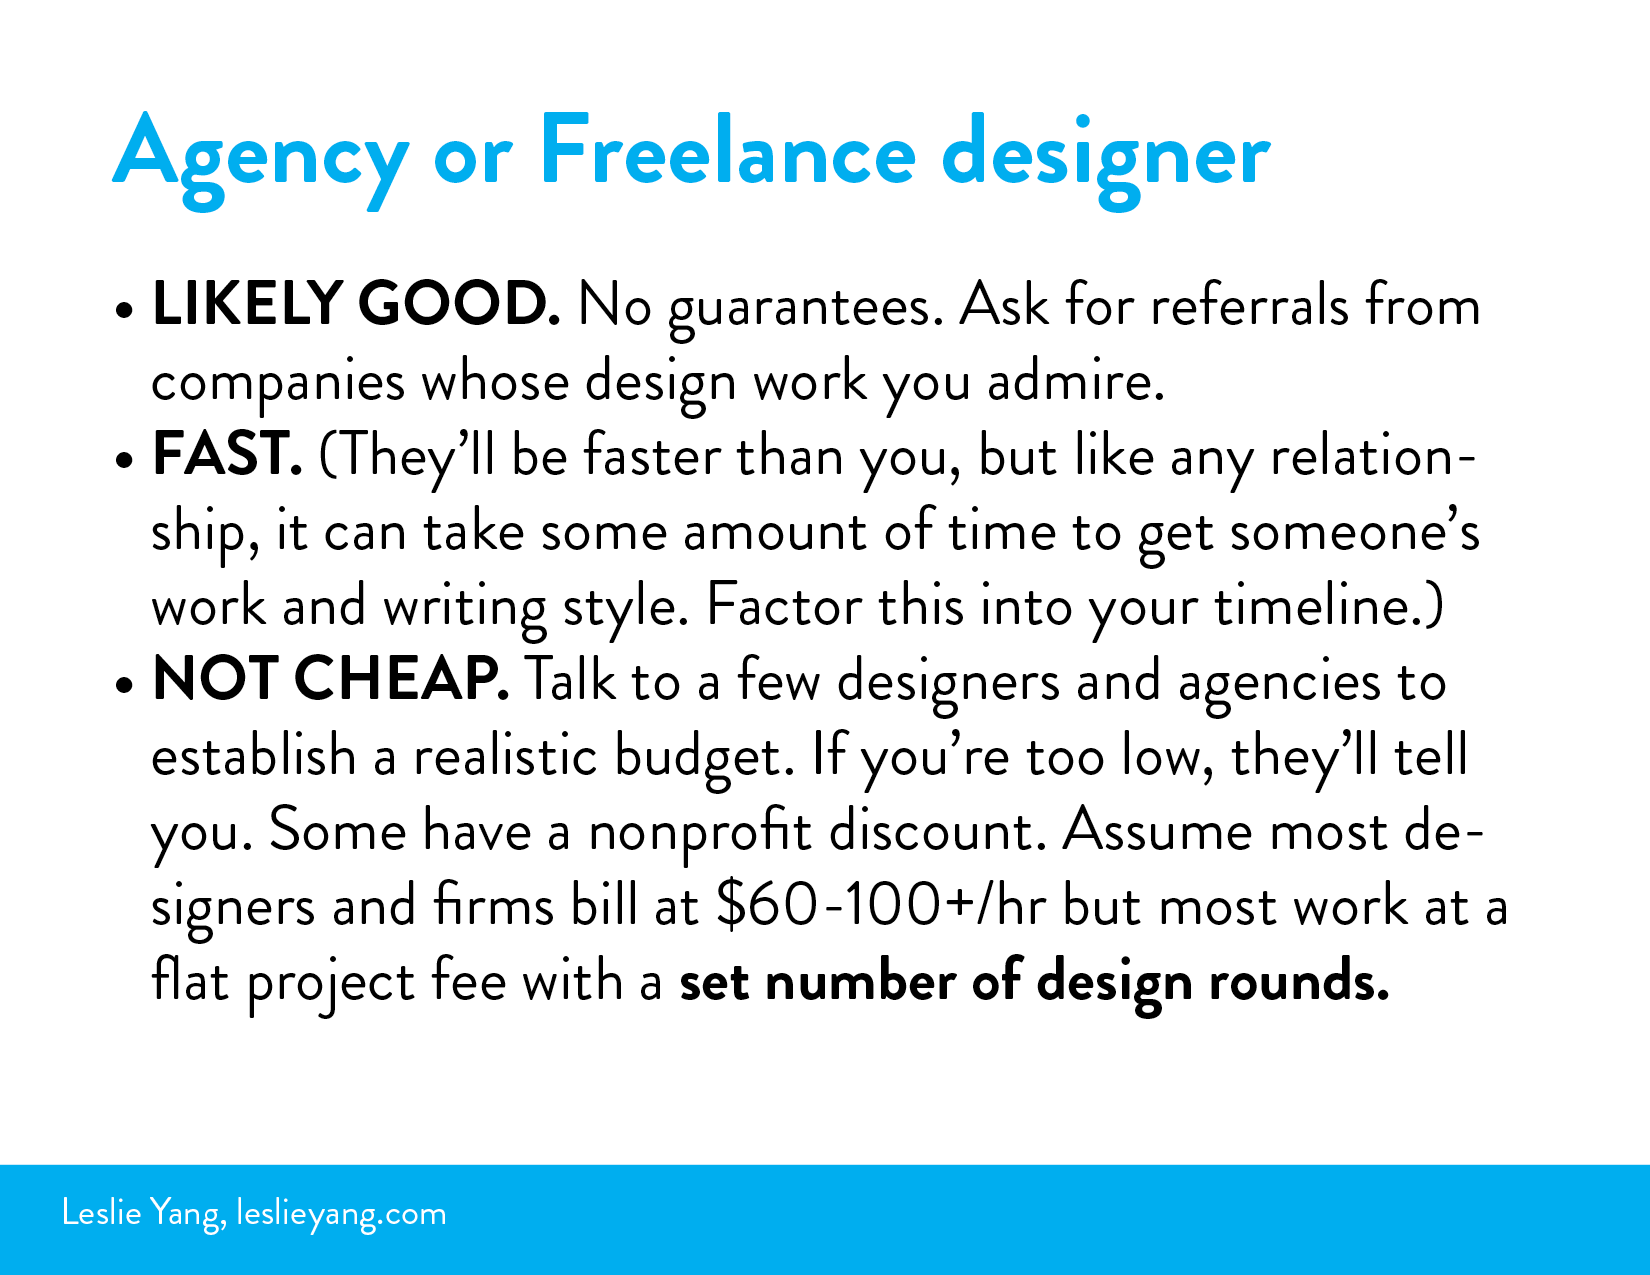
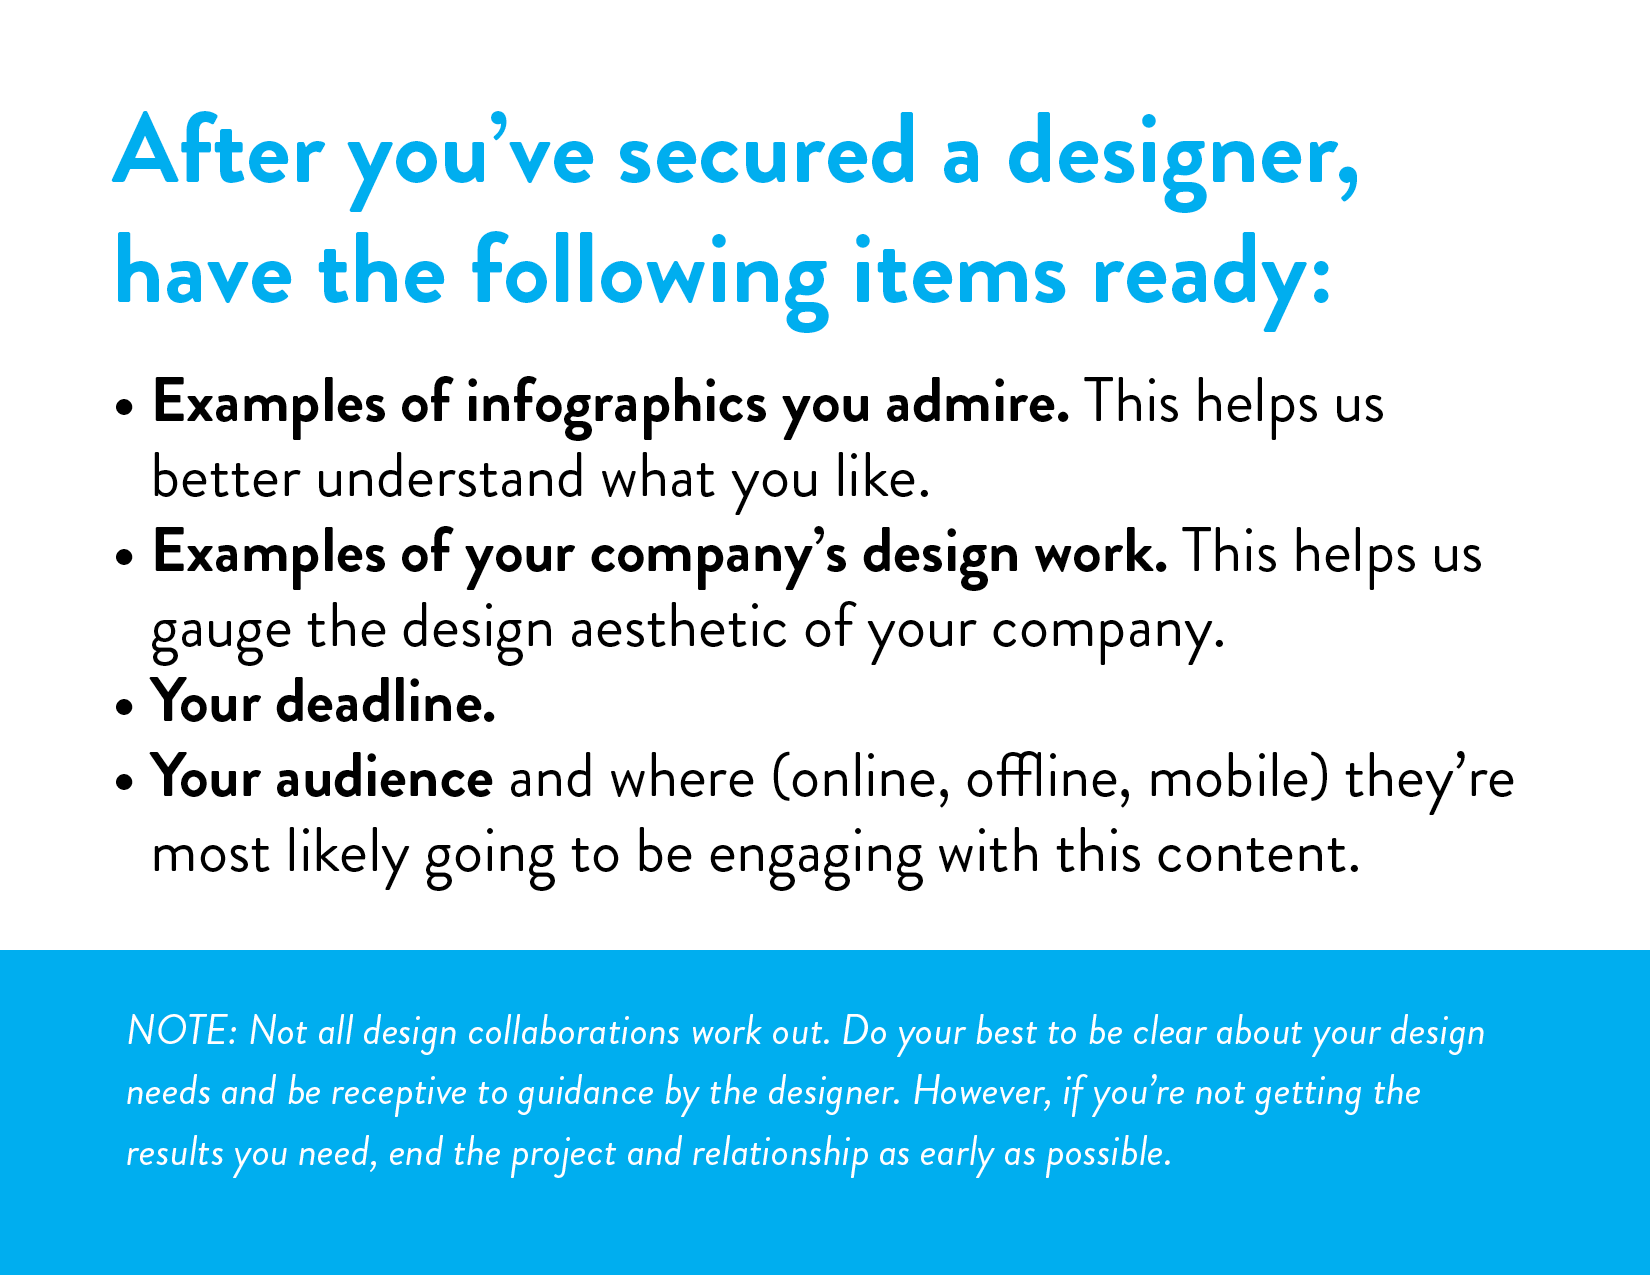
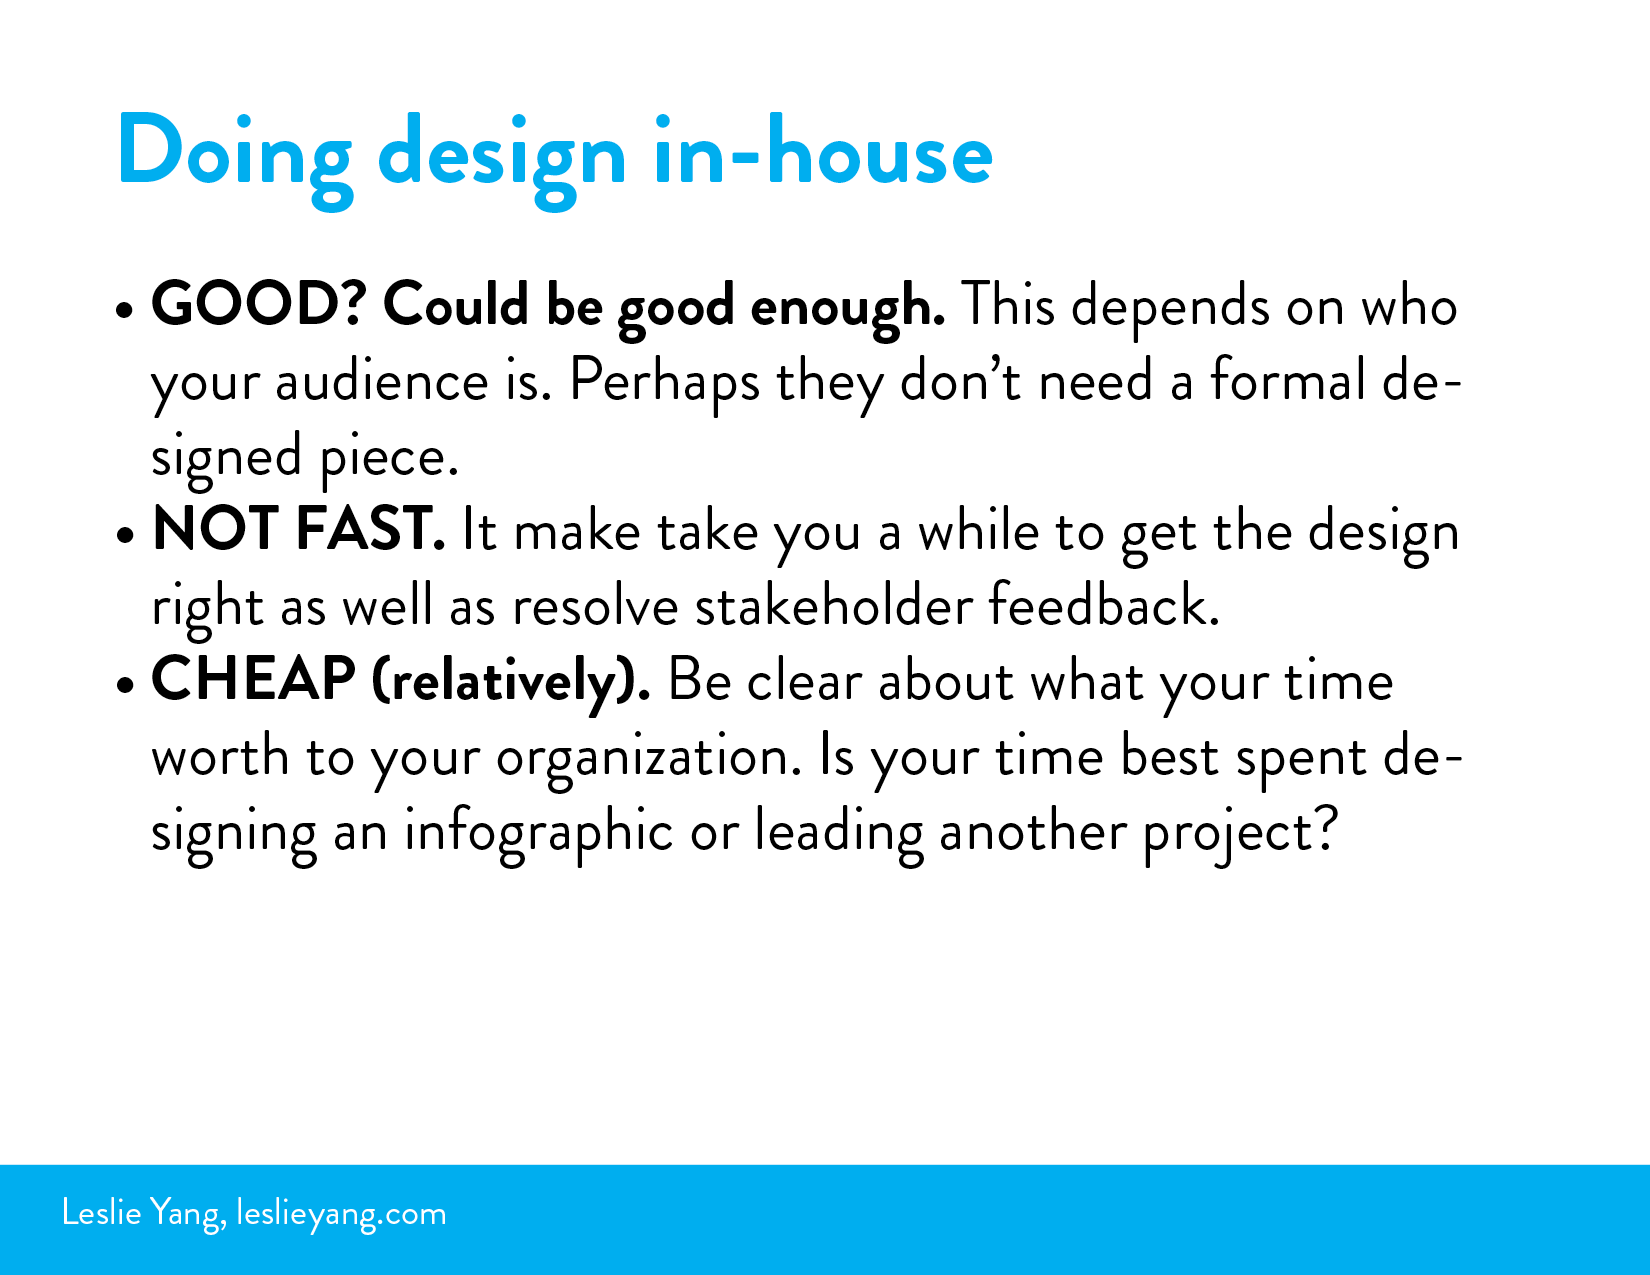
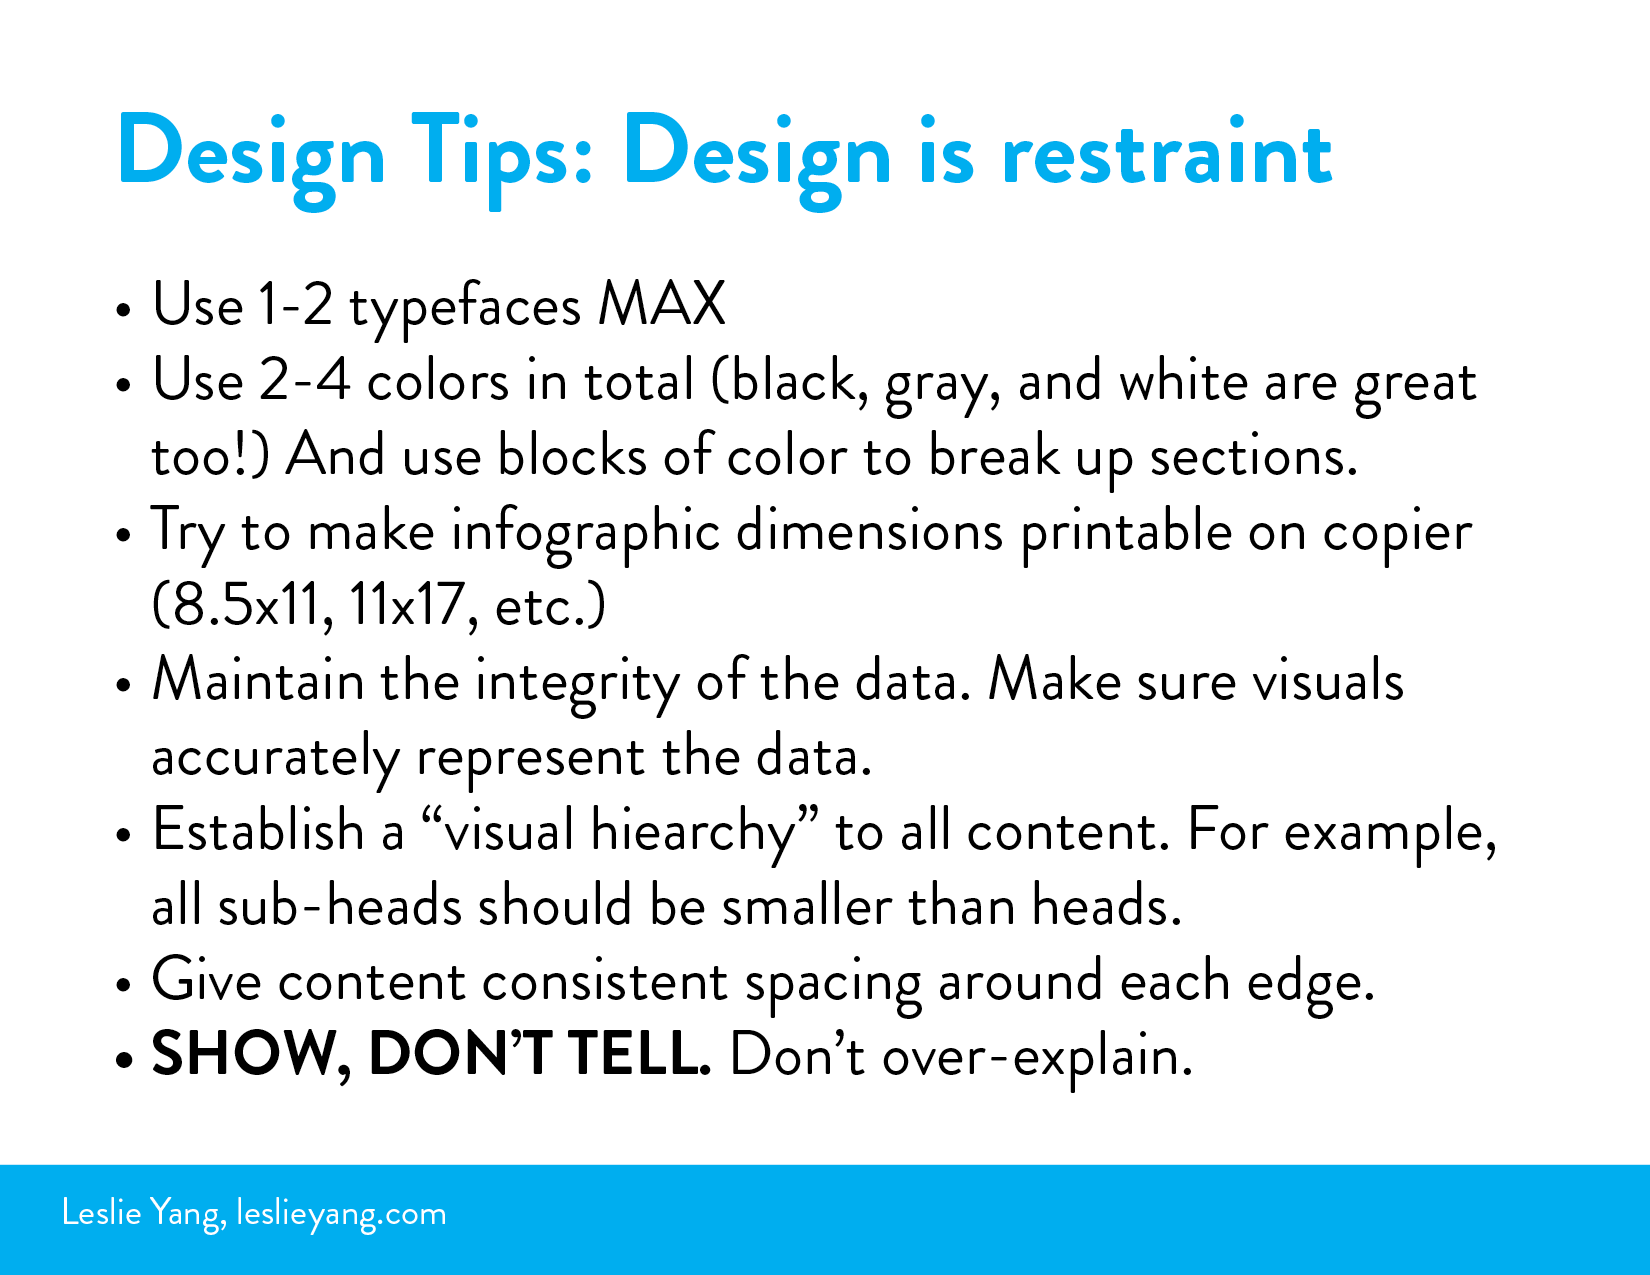
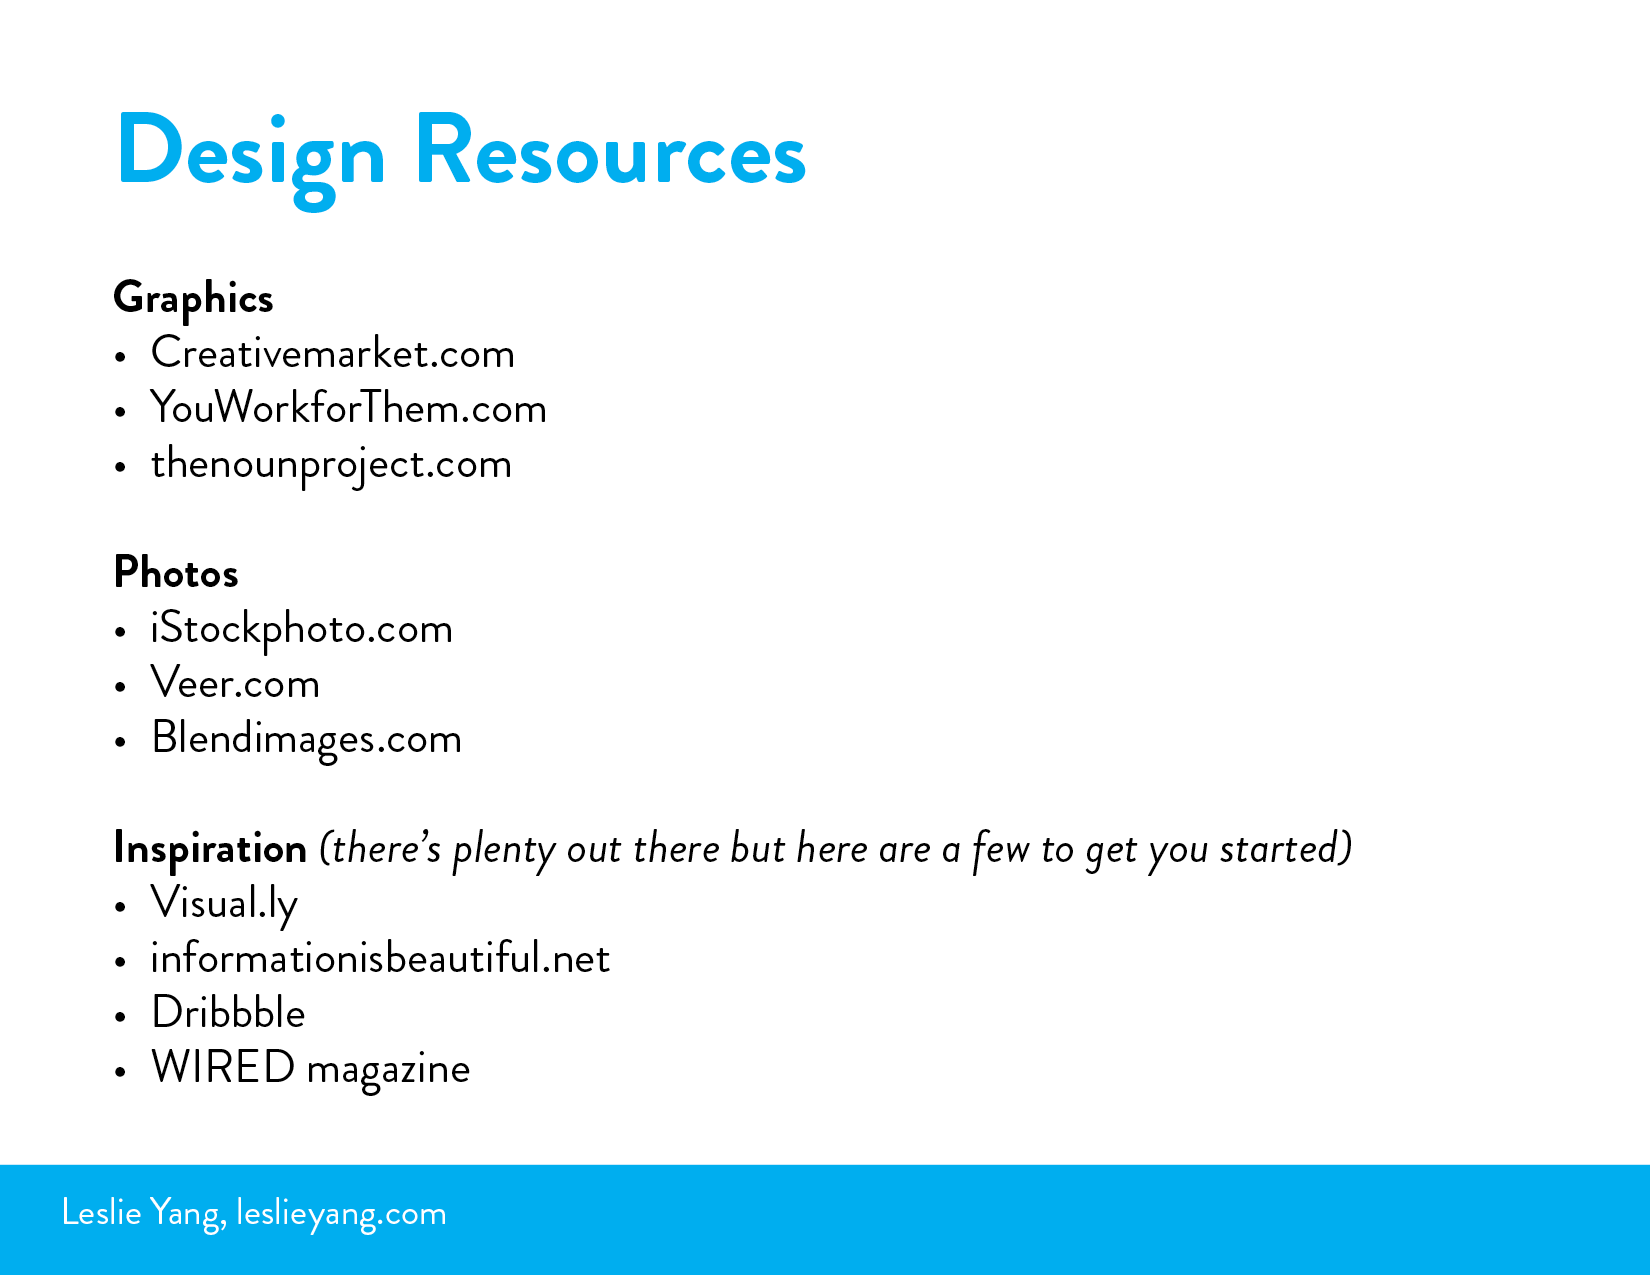
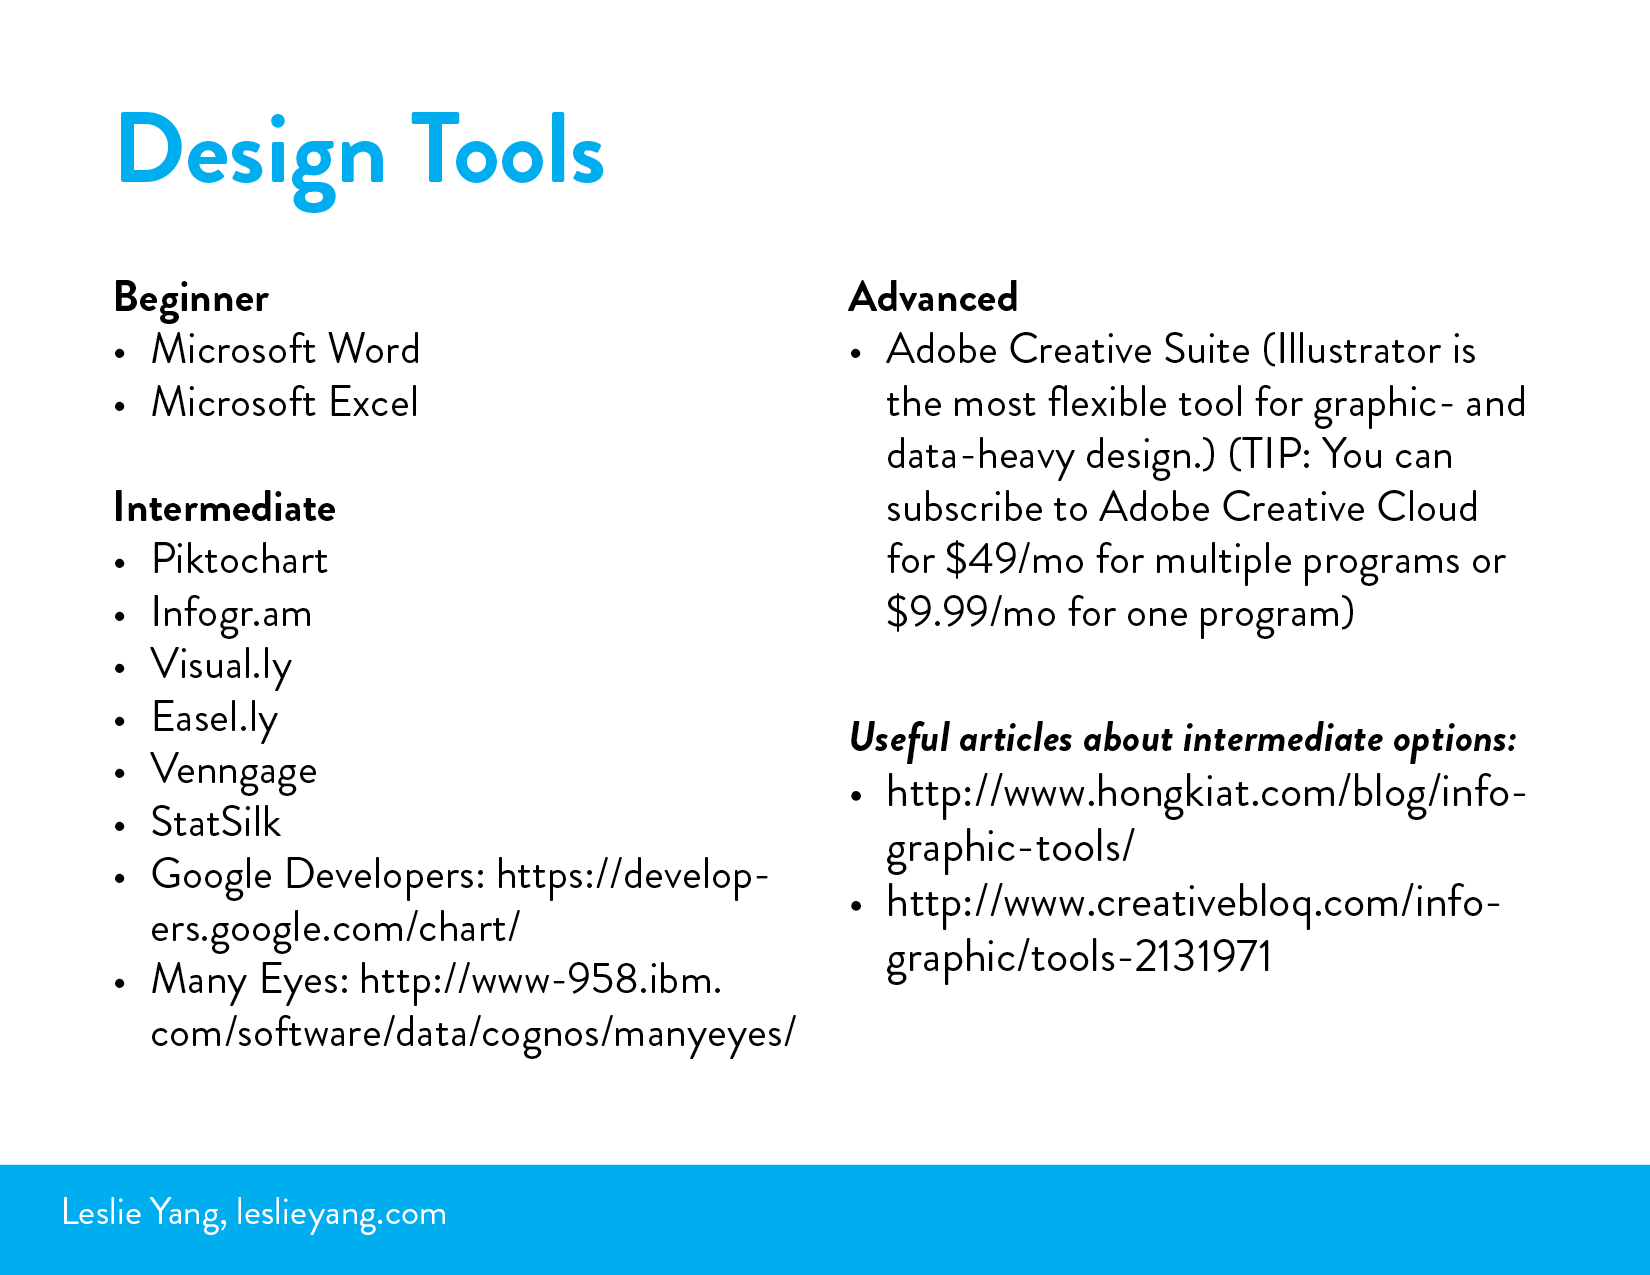
I make a few points that aren’t in the deck:
I heard back from the meeting presenter and she said that I specifically got a ton of positive and glowing feedback from their post-presentation survey. :)
I’m Chinese American and while I'm not terribly superstitious, lately I've taken to thinking of each year as a different beast, full of new lessons and opportunities to learn different ways to approach challenges. This lunar year is the Year of the Wood Horse. Inspired by this article, I plan to imagine this year as a galloping horse; a force for change, inspiration, and positive energy:
The Horse is asking us to appreciate [life’s] changes and advance from them. The energy of this upcoming year will NOT support you if you choose to be a victim. You must become the change you wish to see in the world. We are all connected and the simple acts of changing your attitude and behavior will have a great impact. Be grateful and be mindful with all your actions and you will find that the horse will respond to you with great speed and exhilaration.
Happy new year!

